This guide walks every Veri-Guard surface in the order you'll encounter it — from the dashboard tile through the Veri-Guard overview, an assessment configurator, a live scan, the results page, and the remediation flow that ends in a Just-in-Time Microsoft consent screen. Every screenshot in this guide is from the actual product, captured against a tenant running the same Veri-Guard build that's in your portal.
1 · What Veri-Guard is
Veri-Guard is a Microsoft 365 configuration assessment and remediation engine. It connects to your tenant over the Microsoft Graph API, reads what is actually deployed — Conditional Access policies, Exchange transport rules, Teams meeting policies, Defender configuration, SharePoint sharing settings, Intune endpoint baselines — and compares it against 548 security controls drawn from CIS, CISA SCuBA, NIST 800-53, NIST CSF, ISO 27001, SOC 2, HIPAA, GDPR, EIDSCA, Maester, ORCA, and the Veri-Tech baseline. For each failing control it generates a step-by-step runbook; on the Enterprise tier, 330+ of those runbooks can be auto-executed under Just-in-Time write permissions you grant and Veri-Guard auto-revokes.
The default operating mode is read-only. Write access is requested only at the moment of remediation and surrendered the instant it's done. Break-glass accounts are excluded from every deployed policy. Every action is logged with before-and-after values for rollback.
2 · Where you'll find Veri-Guard in your portal
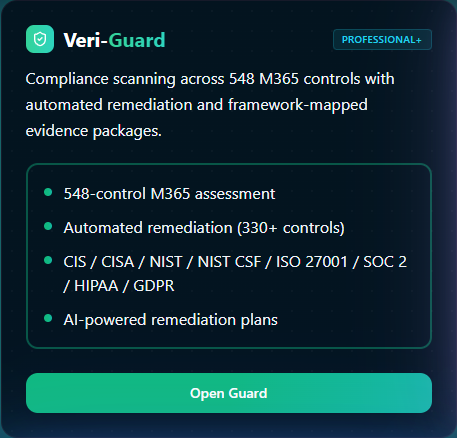
Veri-Guard lives behind one card on your dashboard.
Clicking through lands you on the Veri-Guard overview at /guard. This is the home page for every Veri-Guard surface — its tab strip exposes Overview, Assessment, Control Map, and Score Trends, and the body of the Overview tab is what's pictured below: the stats bar, the four-step process cards, and the recent-assessments list. On Enterprise tenants, multi-tenant comparison is also reachable from here.
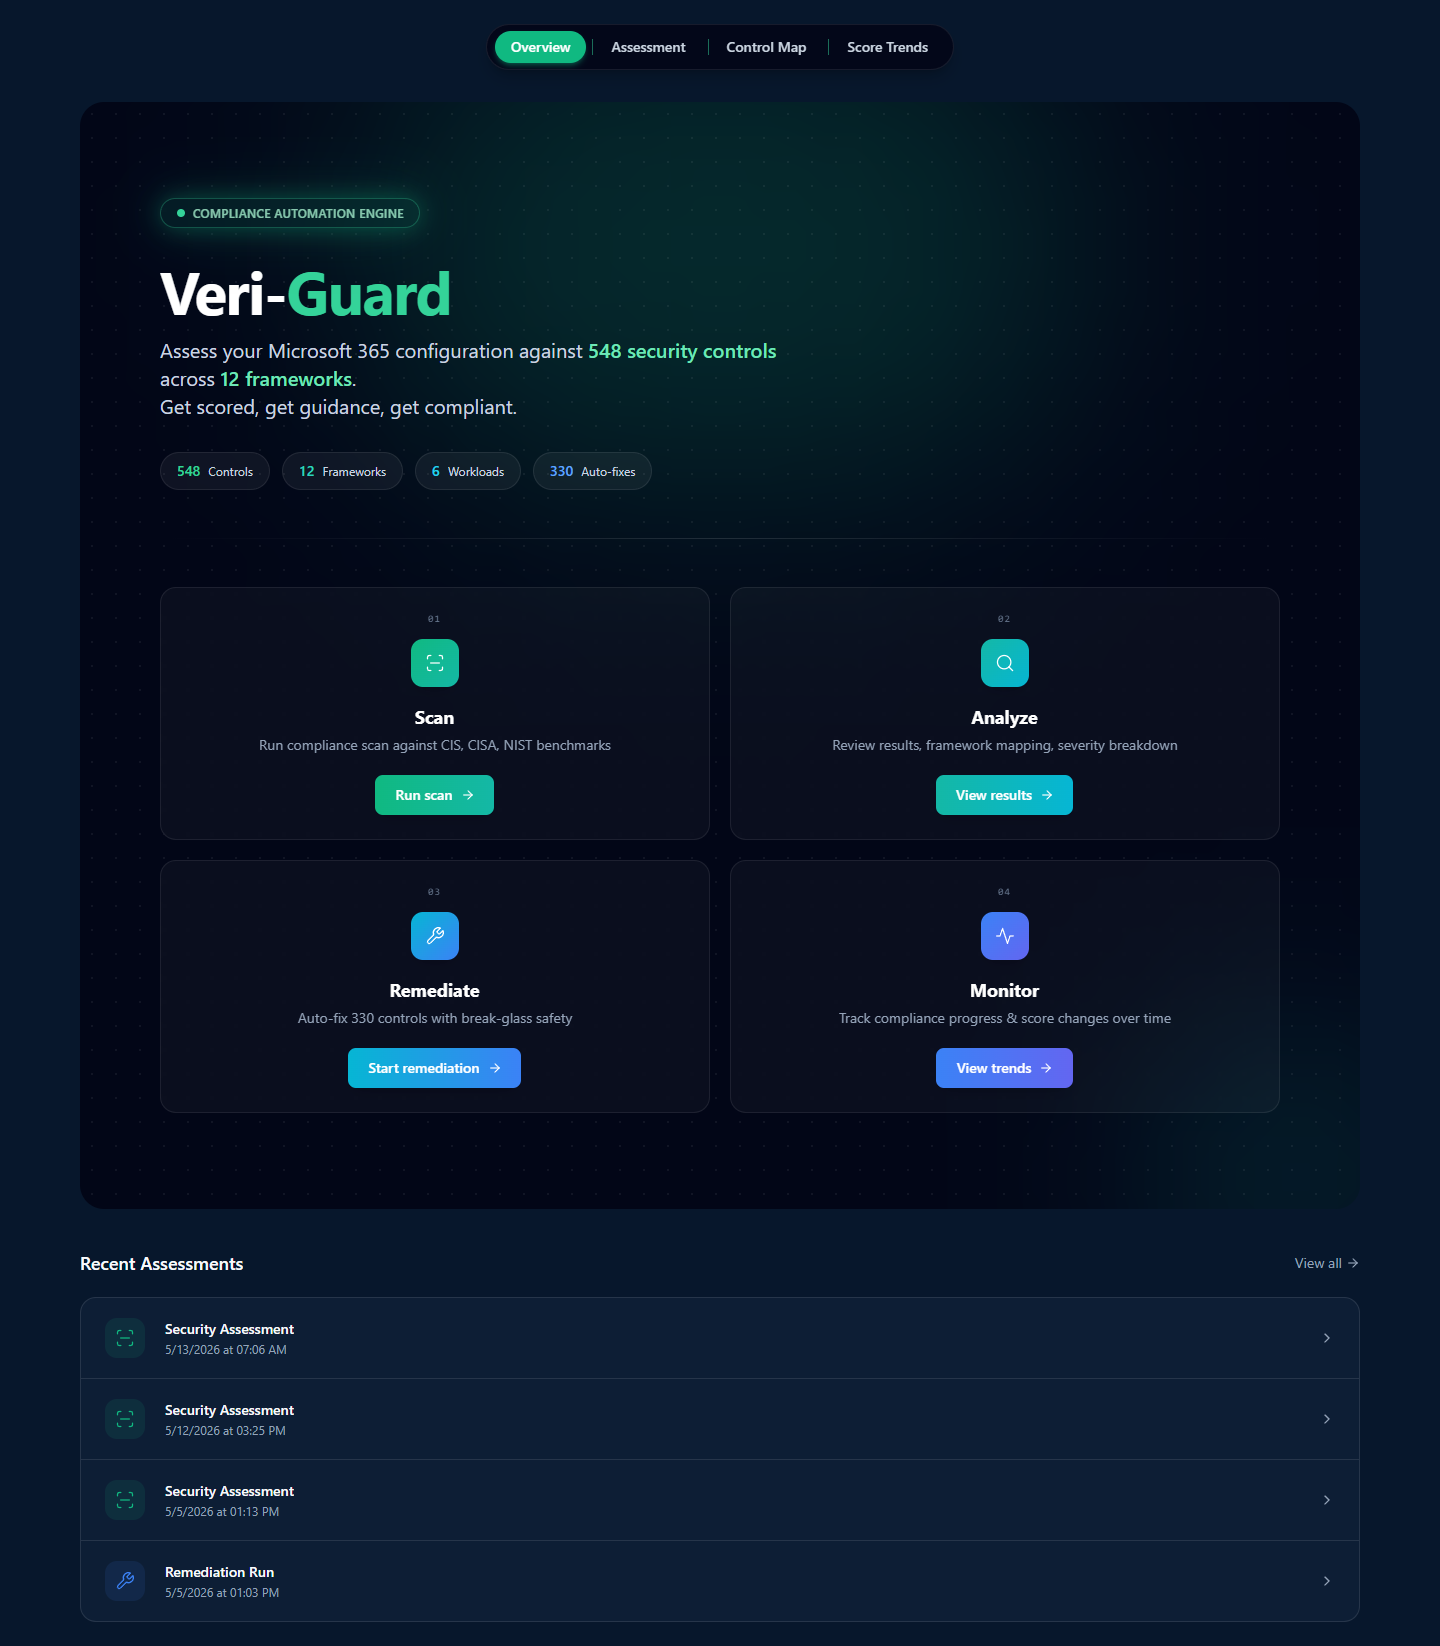
The four cards across the top of the overview are the conceptual model for the entire product. §3 walks each one in turn.
3 · How Veri-Guard works
Veri-Guard is organized around a four-step flow you can complete in roughly the time it takes to grab a coffee.
Step 01 — Scan
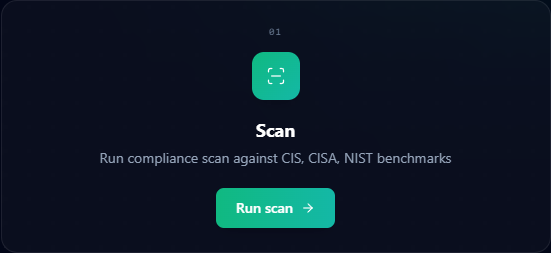
From the Veri-Guard overview, click "Run scan" on the Step 01 card to open the assessment configurator. Pick the framework set you care about, the workloads to include, and click Run Assessment. The Graph API reads your tenant configuration, runs it against the 548-control registry, and finishes in roughly one to five minutes for a typical tenant.
Step 02 — Analyze
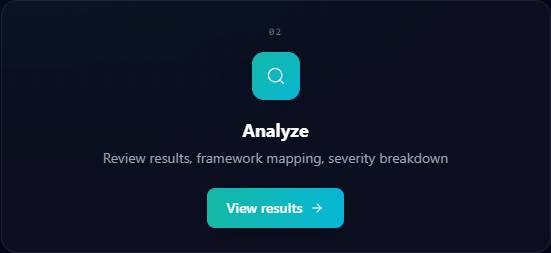
The results page is the densest surface in the product. A weighted overall score sits at the top, with six per-domain rings for Identity, Intune, Exchange, Teams, SharePoint, and Defender. Below that, a framework compliance grid; below that, the per-control results table; and alongside, four analysis tools that help you decide what to fix first.
Step 03 — Remediate
Every failing control gets a runbook in admin portal UI click-through, PowerShell, or Graph API form, with expected output and rollback steps. Your team can execute the runbook by hand — this is the path most teams use, available at any tier. On Enterprise, 330+ controls can also auto-remediate: you click Remediate, Veri-Guard requests JIT write permissions, applies the fix (Conditional Access lands in report-only mode, break-glass accounts excluded), and auto-revokes the write permission when done.
Step 04 — Monitor
After your first scan, scheduled re-scans surface drift the moment it happens. The Score Trends page (/guard/drift) charts your score over time, broken out per domain and per framework, with the controls that flipped highlighted on each scan.
4 · Data handling and Graph permissions
Two things are true of Veri-Guard's data handling and they're enforced at the Graph permission boundary:
- The default operating mode is read-only. Veri-Guard's standing permissions read your configuration — never your content. No email message bodies, no file contents, no audit-log entries, no user passwords.
- Write permissions are Just-in-Time. When you click Remediate, Veri-Guard requests the specific write scope it needs, performs the fix, and auto-revokes. Your tenant never has standing write access from Veri-Guard.
Standing read scopes (active for assessment):
Policy.Read.All— Conditional Access, authentication methods, authorization, consent request, cross-tenant access policiesDirectory.Read.All— users, groups, roles, applications, service principalsSecurityEvents.Read.All— identity risk events, sign-in risk eventsOrganization.Read.All— tenant organization data, branding, settings
Just-in-Time write scopes (only activated by an explicit remediation click):
Policy.ReadWrite.ConditionalAccess— for Conditional Access remediationRoleManagement.ReadWrite.Directory— for RBAC remediationApplication.ReadWrite.All— for app permission and consent-policy remediation
The Microsoft consent screen at the JIT moment (shown later in §9.2) enumerates every scope line-by-line; nothing is hidden behind a single coarse permission.
5 · Safety controls and remediation guarantees
Veri-Guard's automation model exists to not break your tenant. Eight guarantees are wired into every write operation:
- Conditional Access policies are always deployed in report-only mode. Enforcement is a separate, deliberate manual step you take in the Entra admin portal.
- Break-glass (emergency access) accounts are excluded from every deployed policy. The exclusion is verified before any write operation runs.
- JIT write permissions are granted at the moment of remediation and auto-revoked when the batch completes. Standing access stays read-only.
- Disruption risk ratings (None, Low, Medium, High, Critical) are surfaced before every remediation click, calibrated to the specific change being deployed.
- Prerequisite checks automatically skip controls whose required licenses aren't assigned to your tenant.
- Dependency-aware ordering sequences related fixes — enable a CA prerequisite before deploying a policy that references it, never the other way around.
- Remediation rollback undoes changes within 24 hours from a single button on the assessment's audit log.
- Full audit trail logs every write with before-and-after values, the user who authorized it, and the JIT scope the write was granted under.
6 · Frameworks covered
Veri-Guard scores against twelve frameworks, all cross-mapped from authoritative public sources, so one assessment populates evidence for every framework you report against.
- CISA SCuBA — federal baselines for M365 (the cloud Secure Configuration Baseline)
- CIS Microsoft 365 — Center for Internet Security M365 Benchmark
- NIST 800-53 and NIST CSF — federal control catalog plus the cyber framework
- ISO 27001 — international information security standard
- SOC 2 Type II — Trust Services Criteria
- HIPAA — 45 CFR Part 164 (paired with the HIPAA add-on for full coverage)
- GDPR — EU data protection
- EIDSCA — Entra ID Security Configuration Analyzer baseline
- Maester — community Microsoft 365 security test framework
- ORCA — Office 365 Recommended Configuration Analyzer
- Veri-Tech Recommendations — opinionated baseline beyond the public frameworks
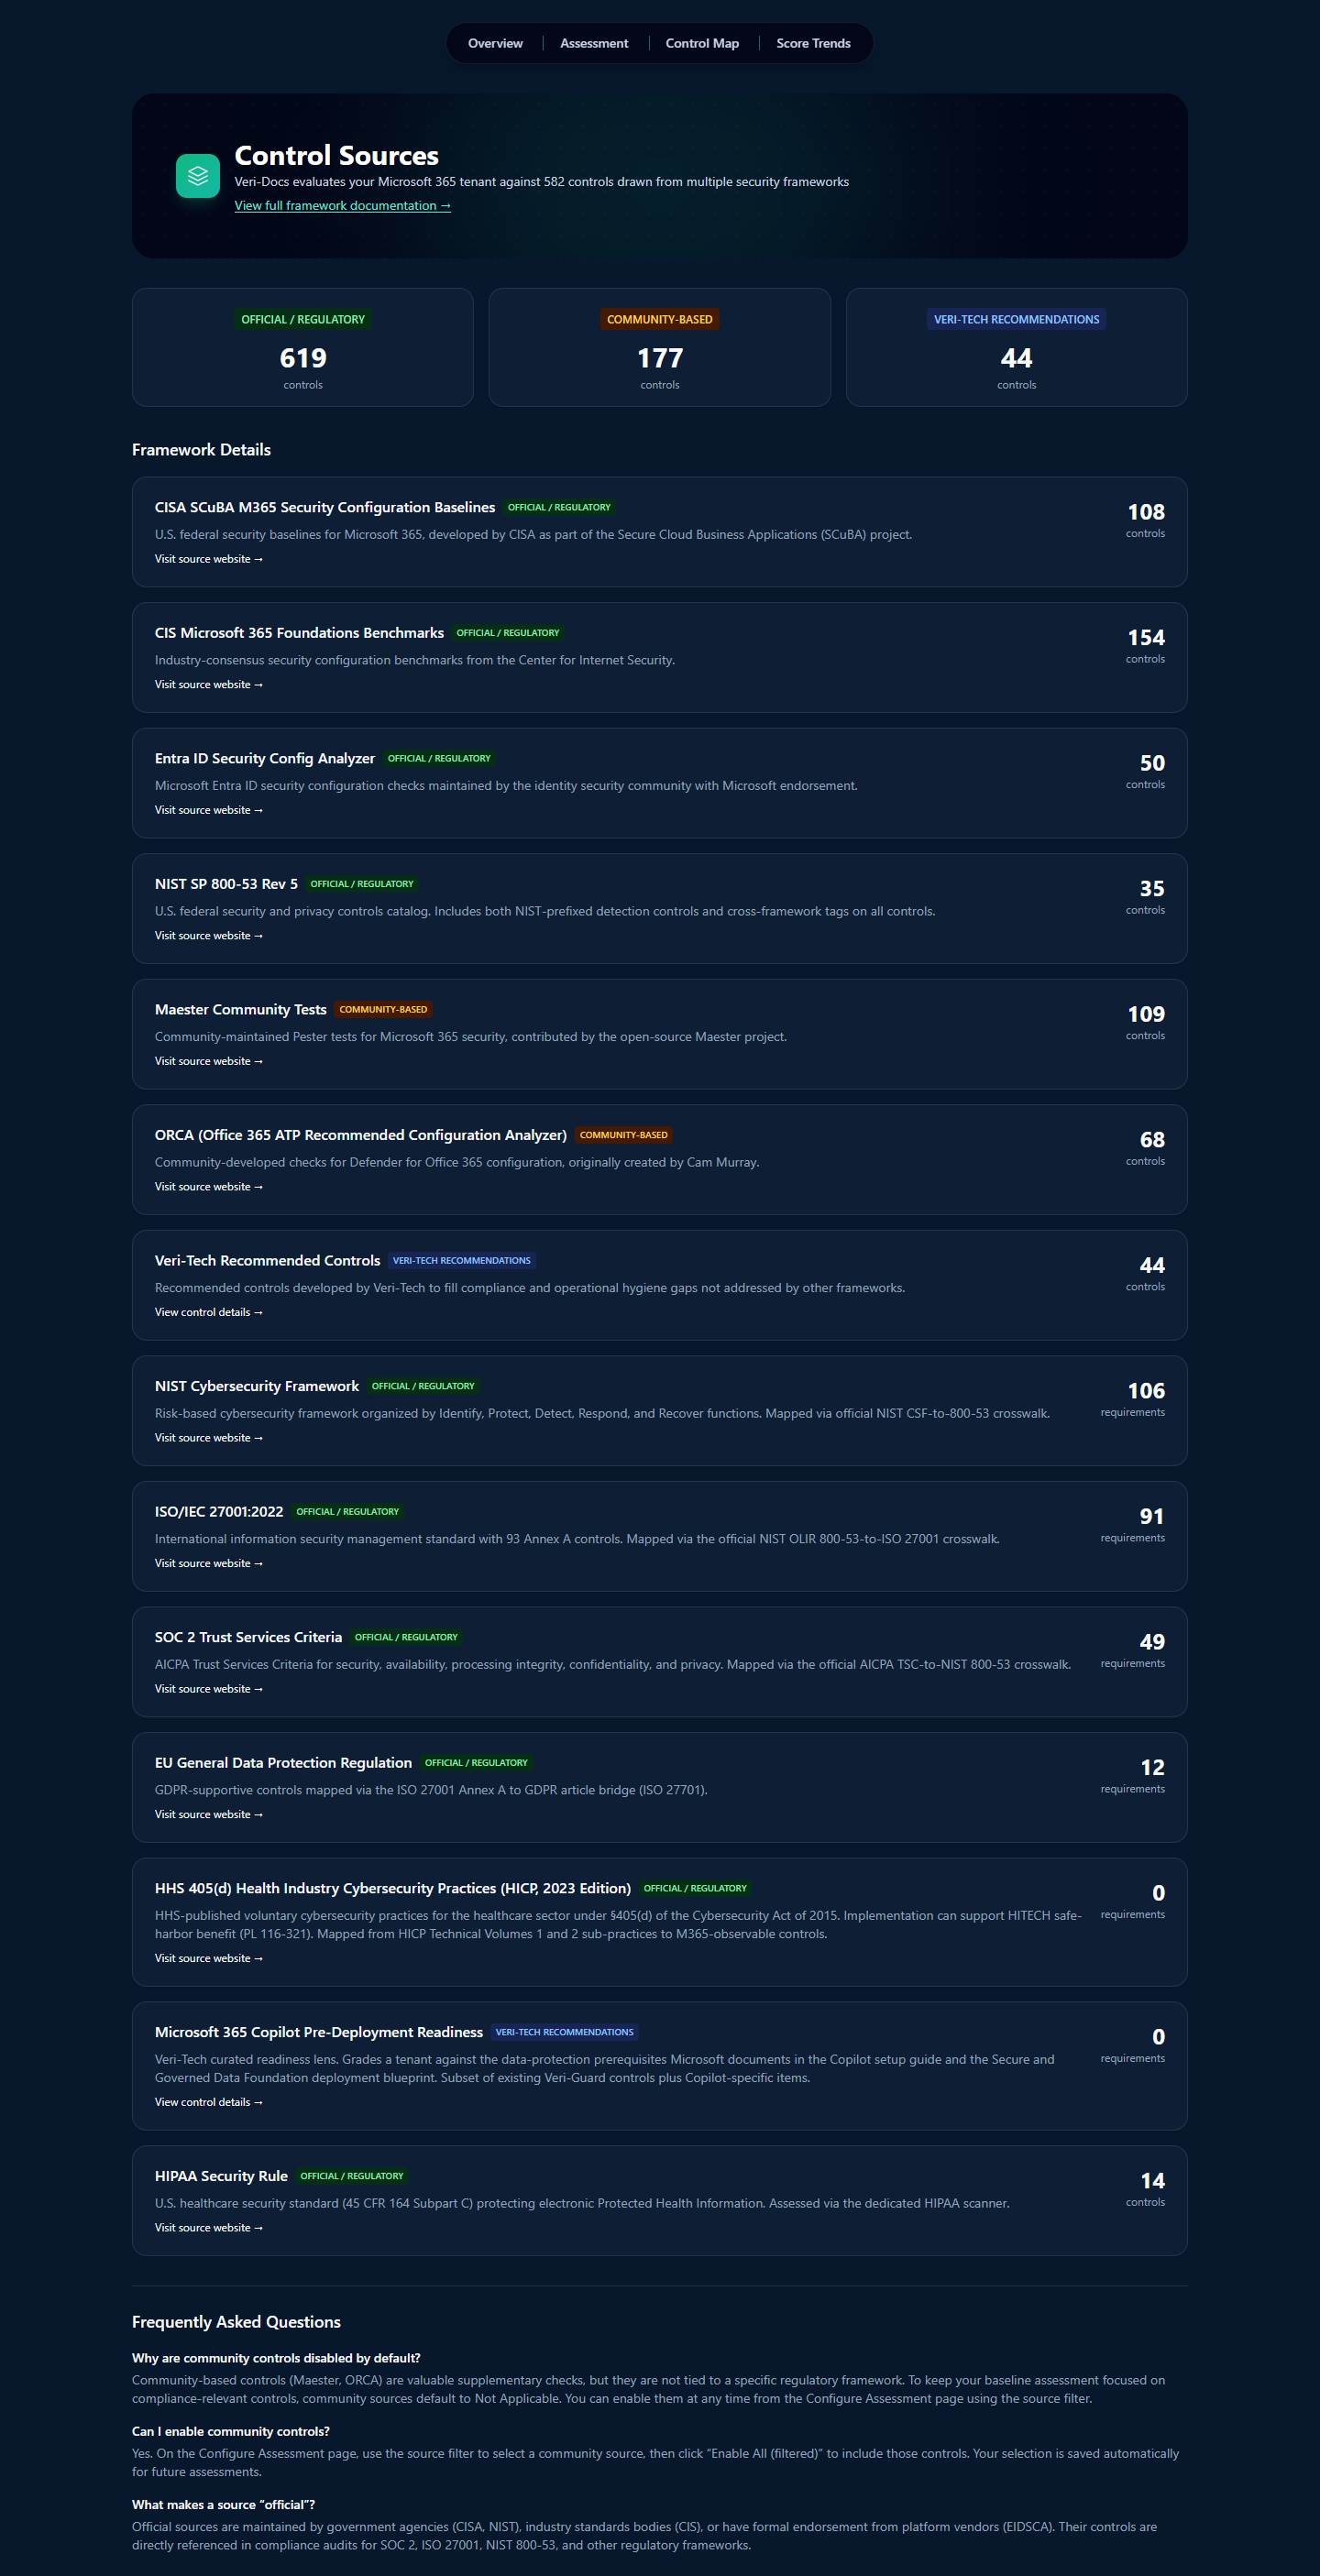
Behind the framework view, every control traces back to a source. The Control Sources page at /guard/control-sources is where to look when you need to know exactly where a finding came from.
7 · Running your first scan
From the moment you sign in, the next five surfaces — onboarding, the Veri-Guard overview, the assessment configurator, the in-flight scan view, and the results page — are the entire first-scan experience.
7.1 · Onboarding (one screen, ~60 seconds)
After signup you land on /onboarding. This is a single-page wizard that completes the M365 connection: admin consent grant for the four read-only Graph scopes from §4, certificate-based authentication (cert is generated client-side and never leaves your browser unencrypted), tenant verification, and a check that your account has the role required to consent on behalf of the tenant.
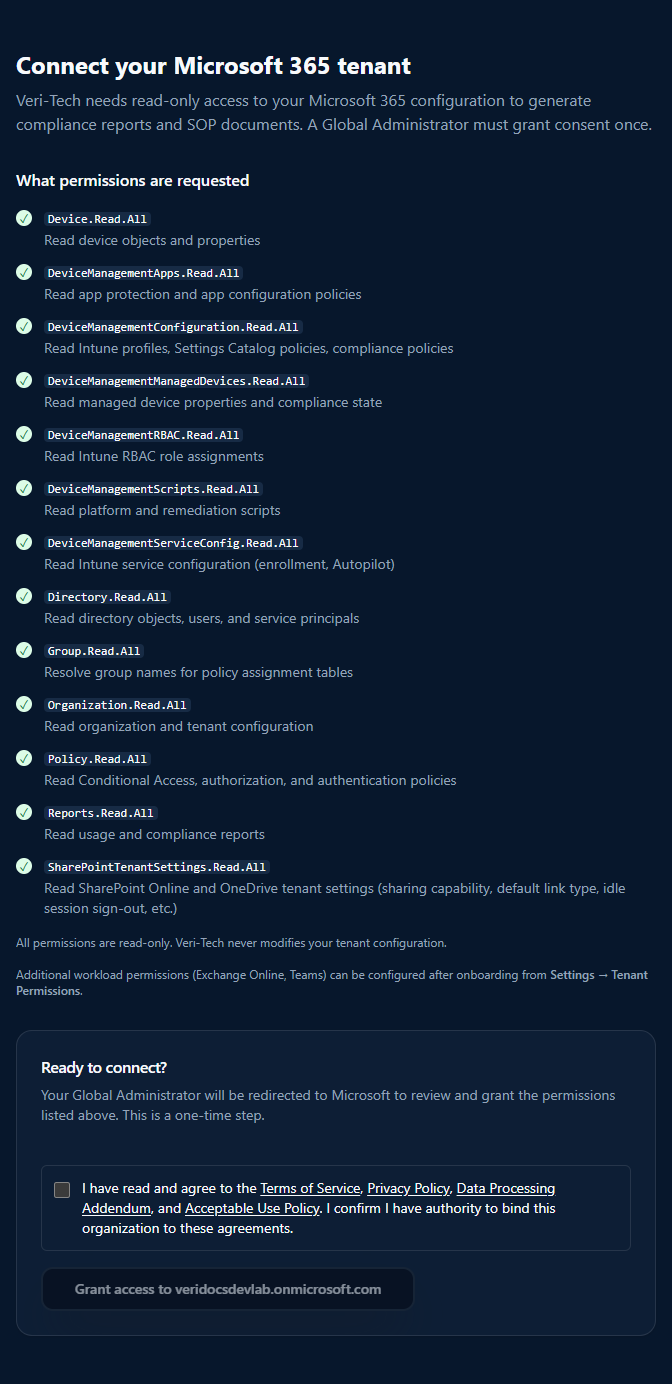
Two things to note here:
- The consent is for read-only scopes only. Write scopes are not requested at onboarding and are not granted to the application as standing permissions.
- The certificate auth means there is no long-lived secret stored on our side. You can revoke at any time from Entra → Enterprise applications → Veri-Tech → Permissions.
7.2 · The Veri-Guard overview (/guard)
Onboarding deposits you back at /guard, the Veri-Guard overview from §2. Click "Run scan" on the Step 01 card to open the configurator.
7.3 · Configuring the assessment (/guard/assessment/configure)
The configurator is where you pick what to scan. The defaults run the full 548-control suite against every framework Veri-Guard knows about, which is what you want for the first run.
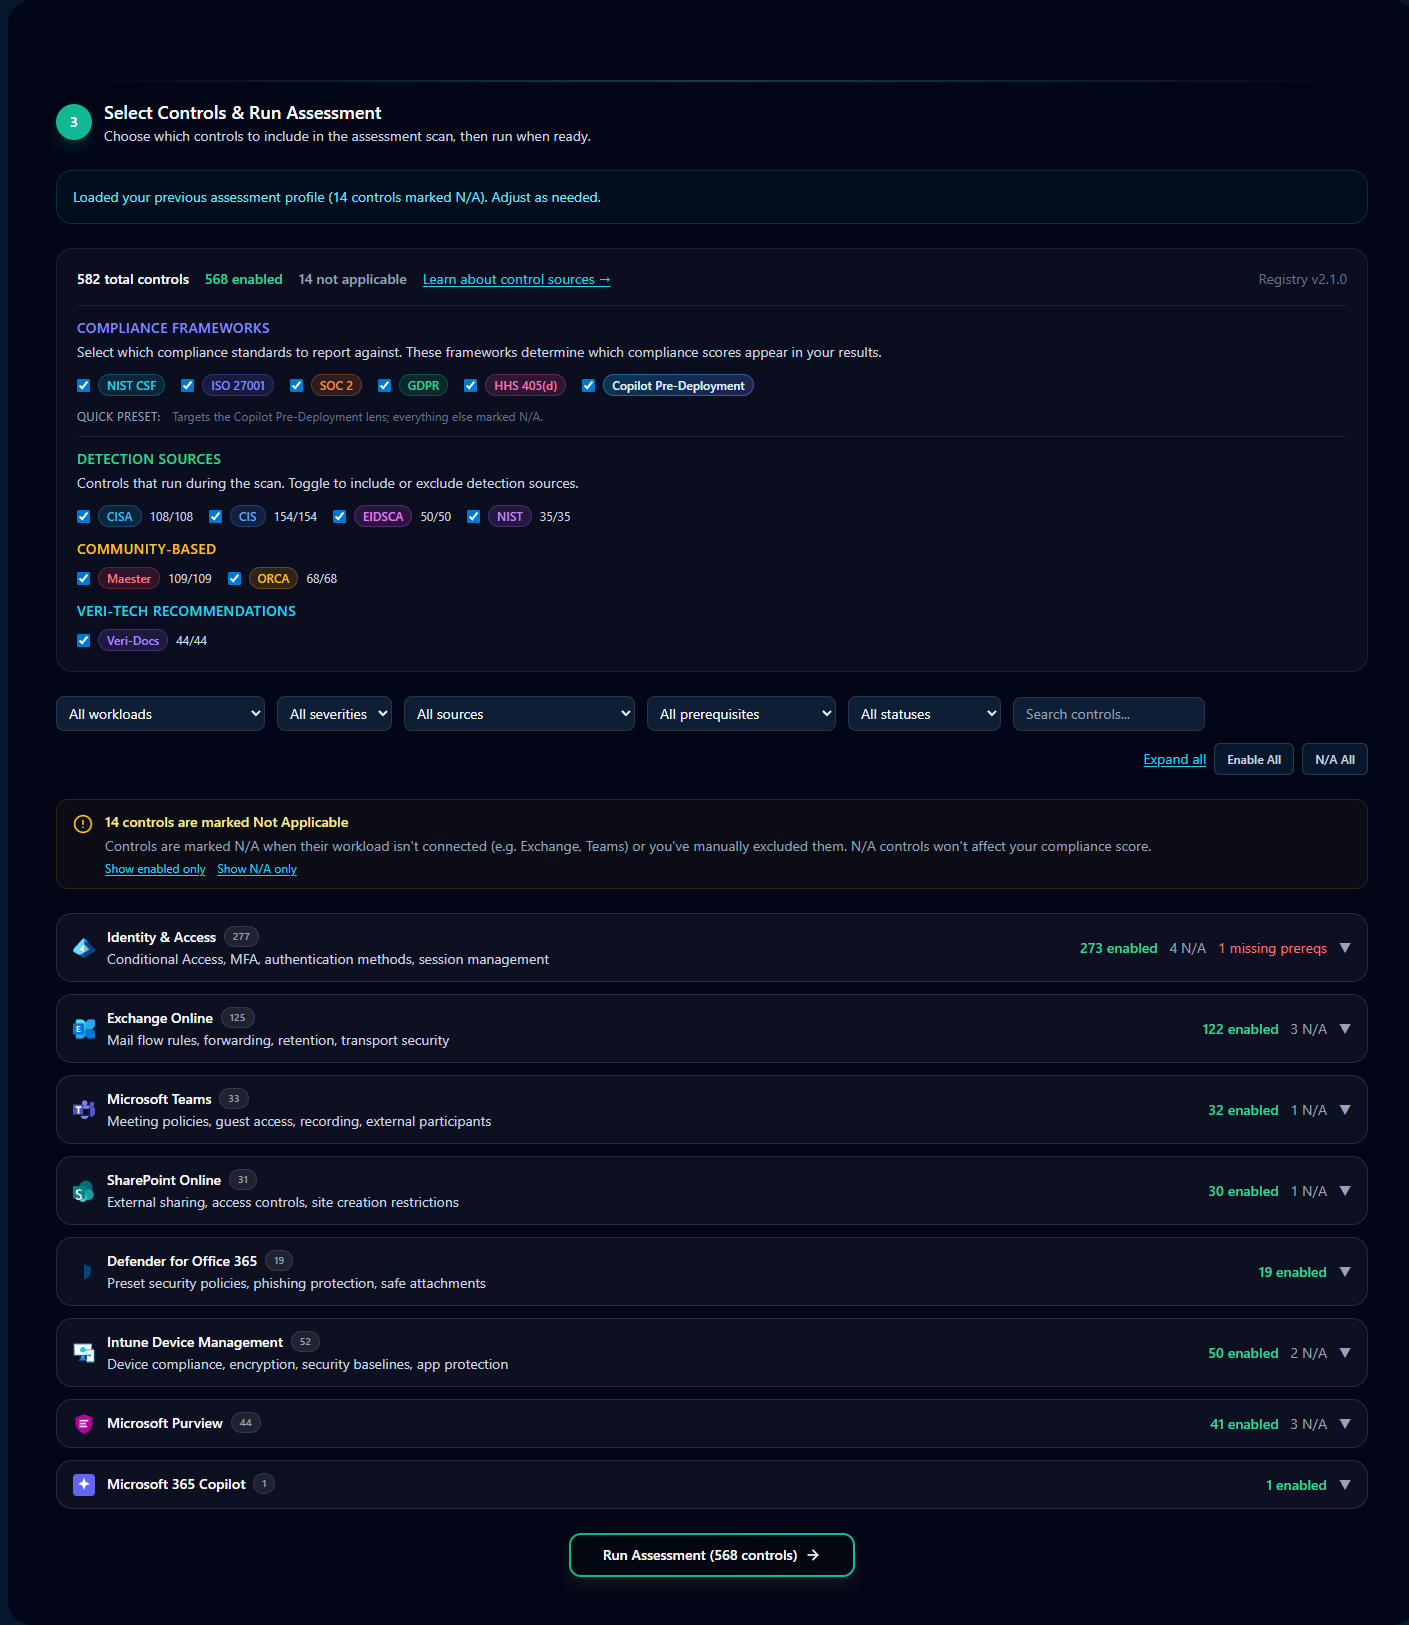
Three knobs are worth knowing:
- Scope — by default the entire 548-control registry runs. You can scope to a single workload (Identity, Exchange, Teams, SharePoint, Defender, Intune) for faster targeted re-runs.
- Framework filter — by default all twelve frameworks are scored. Hide frameworks that don't apply (e.g., HIPAA if you're not in healthcare) to declutter the results view.
- Severity floor — by default every severity is reported. Suppress informational findings on subsequent runs if you've already triaged them.
Click "Start Assessment." The next view is the in-flight scan.
7.4 · The in-flight scan
Most assessments complete in 90 seconds to 3 minutes for a small tenant; up to 5–10 minutes for a fully-populated enterprise tenant scanning every workload against every framework. While running, the page streams per-step status: a step counter (Connecting to cloud services → reading per-workload configuration → control evaluation → score aggregation → finalize), the list of workloads being scanned, the frameworks that will be scored, and an elapsed-time counter.
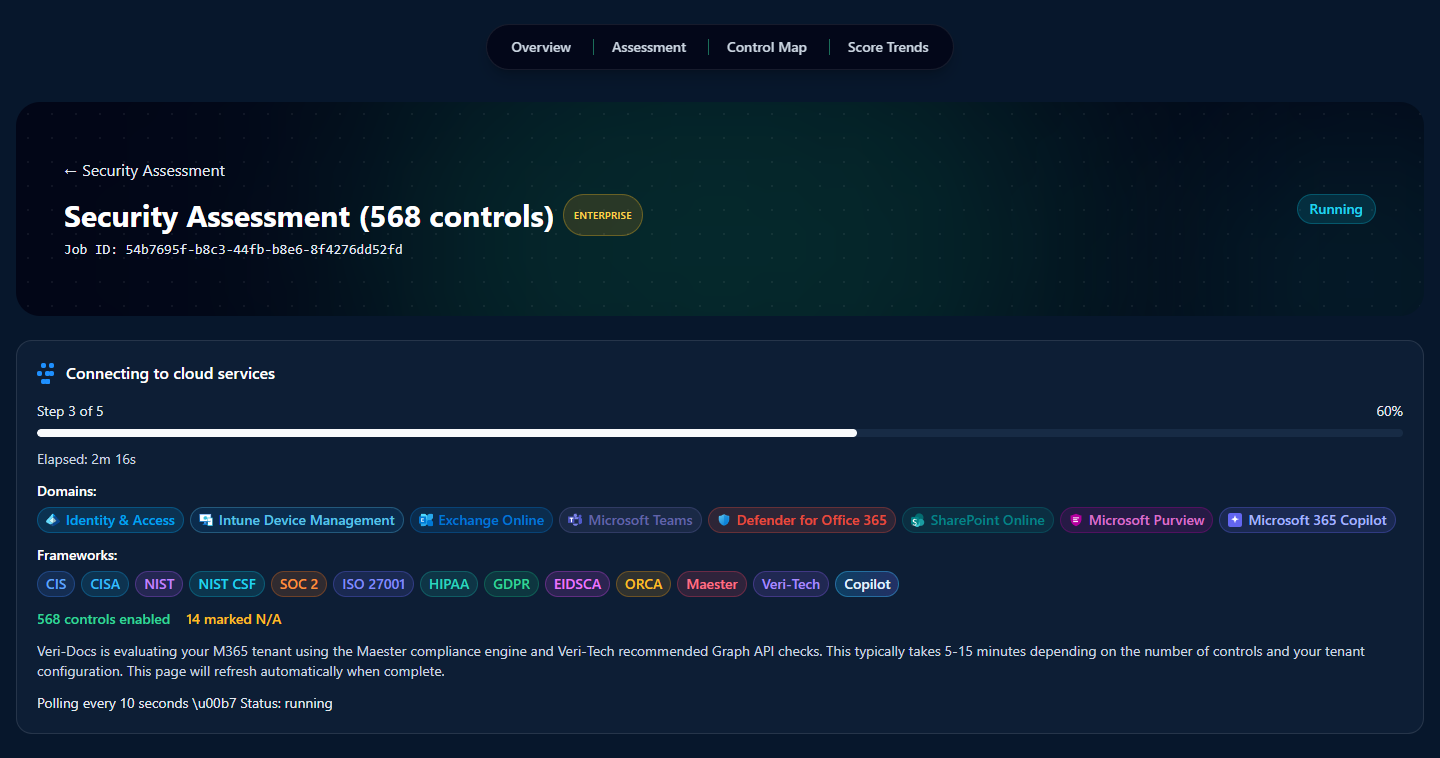
There's nothing to do here except wait — the page auto-advances to the results view the moment the run finishes. That view is §8.
8 · Reading the results
The results page (/guard/[jobId]) is the densest surface in the entire product. Every analysis tool, export action, attestation builder, and the formal scored compliance picture itself all live on one scrollable page. Read top to bottom, the page organizes itself into four bands:
- Cross-product lens entry-points — alternate views of the same scan data (Copilot Pre-Deployment lens) and an AI-narrative summary (AI Insights).
- Workflow tools — Risk Exceptions (waive a control with justification), Generate Identity-Attack Tabletop (spawn an IR exercise from your gaps), and the Remediation Planner entry point (full walkthrough in §9).
- Document and attestation exports — Generate Docs From Last Report, Executive Report, Compliance Packages, and the Compliance Certificate.
- The scored picture — Assessment Score, Domain Scores, Framework Compliance, the Control table, Quick Win Bundles, and the What-If Simulator.
The rest of this section walks each in that order. None of it is hidden behind tabs or modals — everything below is on the same page, just scrolled.
8.1 · Copilot Pre-Deployment Readiness lens
Above any of the scoring, a small banner sits at the very top of the results page offering an alternative view of the same scan data through the Copilot Pre-Deployment Readiness lens — a 14-control subset of the broader assessment scoped to Microsoft's official Copilot deployment guidance: oversharing controls, agent governance, prompt and output guardrails, sensitive-data label coverage, and DLP rule presence.

The lens reuses the same control results from the assessment you just ran; it doesn't re-scan. It's the right view to share with an exec or board when the question is "are we Copilot-ready" rather than "what's our overall security posture."
8.2 · AI Insights
The AI Insights block is an LLM-generated narrative analysis of the full results, written from your specific scan rather than from generic templates. Three subsections:
- Key Findings — four to six bullet points calling out the highest-signal patterns the model saw across the control set ("mobile device management is fully compliant; identity controls are weakest at 60%").
- Top Risks — three to five business-risk framings. Not "control CIS-X.Y failed" but "unrestricted global admins create blast-radius risk" — the language a CISO or risk officer would put in front of the board.
- Recommended Next Steps — an ordered five-item action list, sequenced by impact, that an admin can read top-down and start executing without re-doing the analysis themselves.
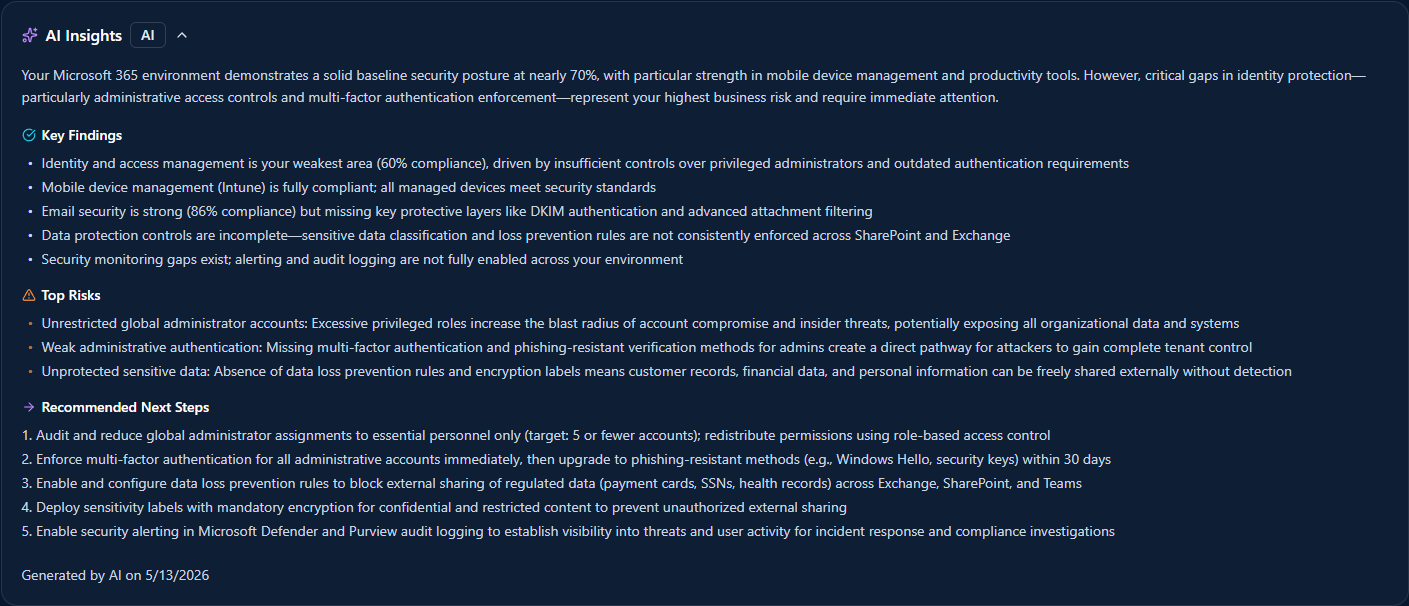
The narrative is a complement to the structured analysis tools further down (Quick Win Bundles, What-If Simulator), not a replacement. For the 80% case of "show me what to do about this," it's often the only block someone reads.
8.3 · Risk Exceptions
Some failing controls aren't going to be fixed — the workload is out of scope, the control doesn't apply to your deployment, or the business has accepted the risk in writing somewhere else. The Risk Exceptions block tracks those.

Click "+ Accept Risk" on a control row and add a justification; that control gets pulled out of the scored picture and into the Risk Exceptions list with the timestamp, the admin who accepted it, and the justification text. Waived controls are excluded from scoring on subsequent assessments until you un-waive them. Auditors get the exception list as a separate artifact — they see both the controls that passed and the controls you explicitly accepted risk on, with reasoning.
8.4 · Generate Identity-Attack Tabletop
Veri-Guard ships an Identity-Attack tabletop generator that takes your scan data and produces a facilitator-ready incident-response exercise — scenarios drawn from the actual gaps in your tenant, injects timed for a live drill, and a scoring rubric to grade your team's response.
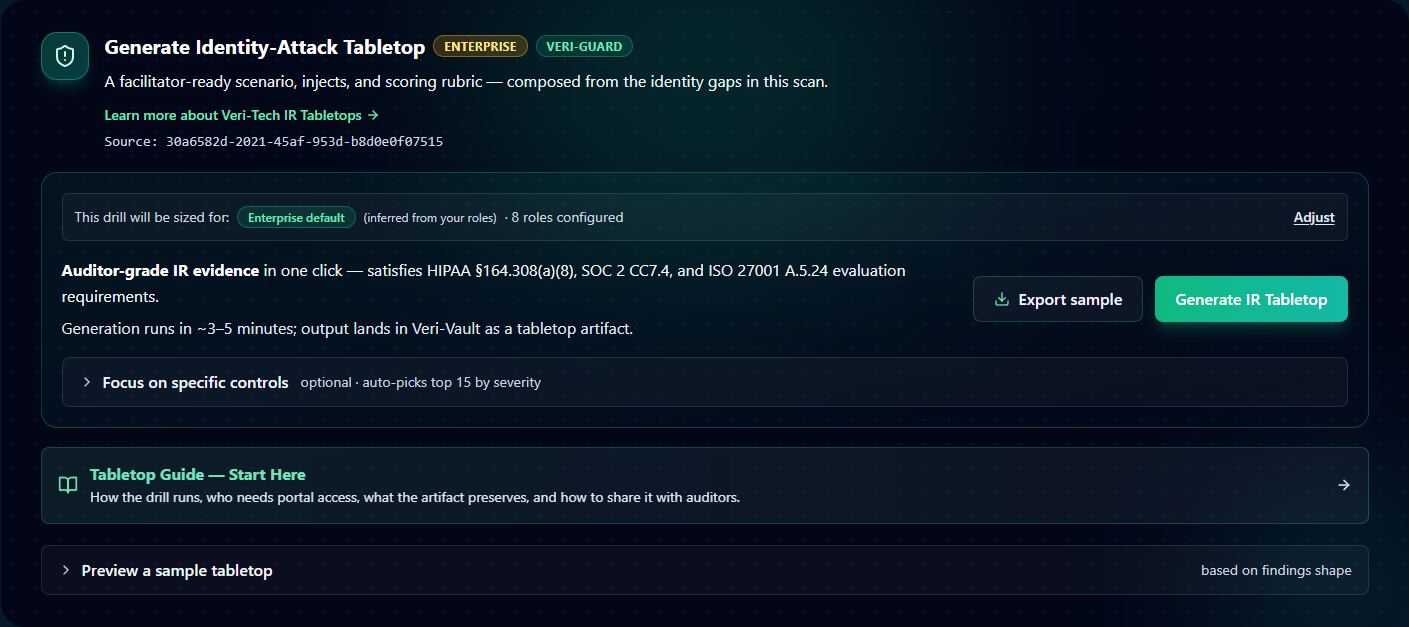
Click "Generate IR Tabletop" and the exercise runs in Veri-Vault as a tabletop session — facilitator dashboard, attendee read-only view, the works. The artifact satisfies SOC 2 CC7.4, ISO 27001 A.5.24, and NIST IR-3 evaluation requirements; one IR Tabletop session per quarter is the typical cadence customers run.
8.5 · Remediation Planner
The Remediation Planner card on the results page is a thin entry point — it surfaces the eligible auto-remediations and queues them up for the full Remediation flow. The deep walkthrough of the planner — batching, dependency ordering, the Dispatch page, the JIT consent moment — lives in §9 where it belongs.
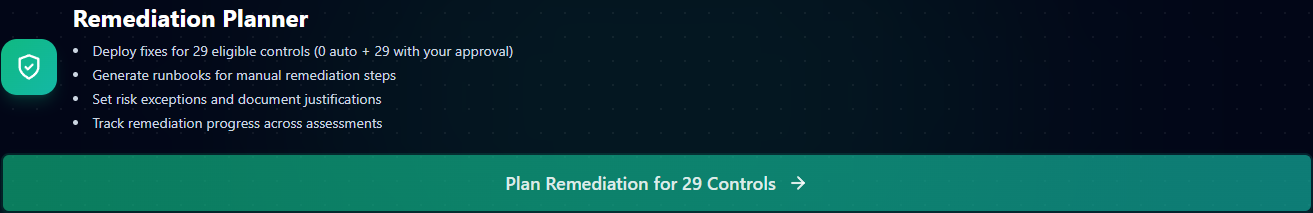
From the results page, just know: click "Plan Remediation for N Controls" and you land on the planner. The full multi-step remediation story is §9.
8.6 · Generate Docs / Executive Report / Compliance Packages
Three export cards live as a row directly below the workflow tools:
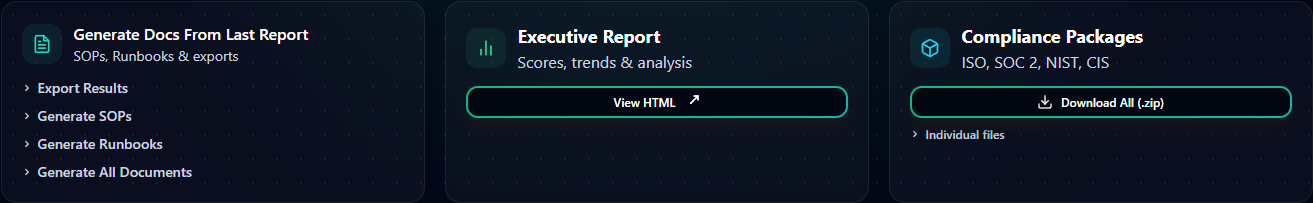
- Generate Docs From Last Report — runs the results through the Veri-Docs SOP/runbook generator. Export raw results, generate per-control SOPs, generate per-control runbooks, or generate the complete document set in one click. Useful right after a scan when you want the policy documents that should accompany the fixes you're about to make.
- Executive Report — a board-ready HTML report with the headline score, trends, and the Top Risks framing from AI Insights. "View HTML" opens it in a new tab; same artifact Veri-Guard generates for the monthly executive cadence (per §3 Monitor step).
- Compliance Packages — per-framework auditor evidence bundles. "Download All (.zip)" packages every supported framework (ISO, SOC 2, NIST, CIS, …) into a single archive with a SHA-256 signed manifest. "Individual files" lets you pick just the framework an auditor is asking about. Every claim in the bundle is traceable to a specific control in the scan; every control links back to its source authoritative document.
8.7 · Compliance Certificate
Distinct from the Compliance Packages, the Compliance Certificate is a single-page verifiable attestation — a public URL with a SHA-256 signed claim that says "tenant X passed Y% of N controls across these frameworks on this date."

Share the URL with auditors, customer security teams running vendor questionnaires, or cyber insurance carriers. The signature is verifiable by anyone with the URL; the underlying scan data does not need to be exposed for the verifier to confirm the certificate is authentic. The certificate is generated on demand from this card.
8.8 · Assessment Score
Below the four exports sits the Assessment Results section header, and immediately under it the Assessment Score card — the canonical scored picture of your scan.
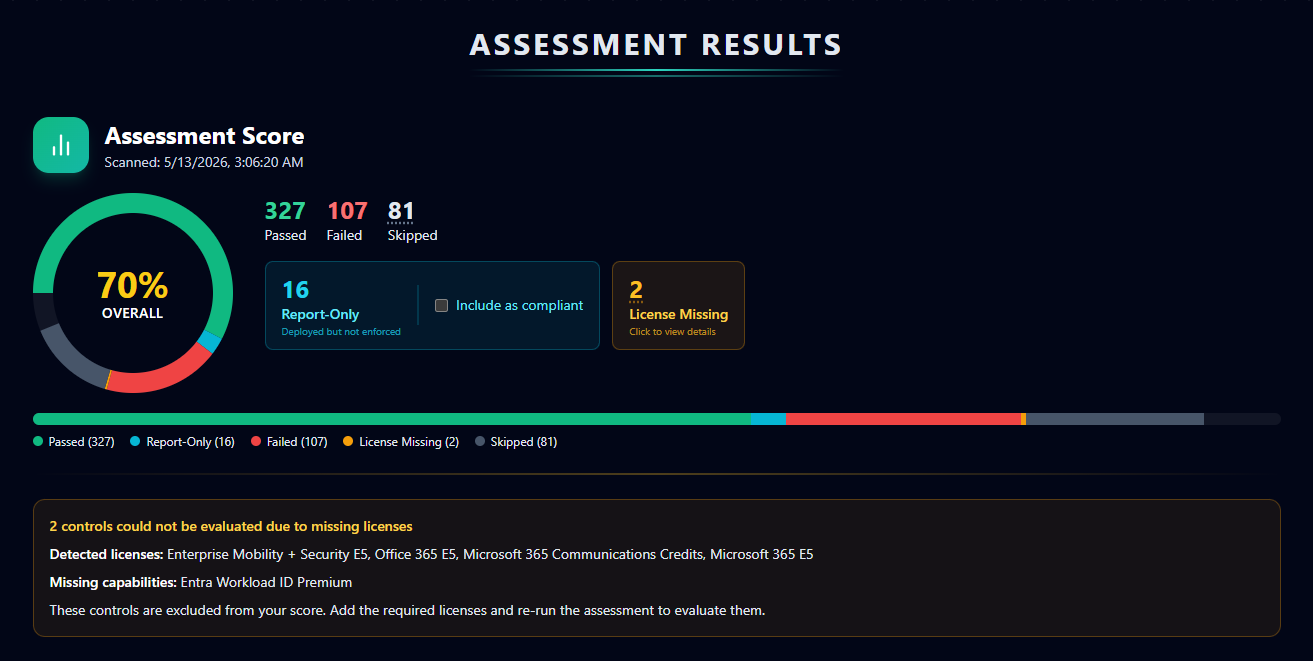
The big donut chart packs a lot of information into a small area; here's how to read it:
- Overall percentage — the headline weighted score. The weighting accounts for both control severity (a Critical fail counts more than an Informational fail) and framework coverage (a control mapped to seven frameworks counts more than a control mapped to one). 70% isn't just "70 of 100 controls passed" — it's "70% of weighted compliance."
- Passed / Failed / Skipped — the raw control-level counts. Skipped controls are ones that didn't run (configurator excluded them, license not present, etc.) and don't move the score in either direction.
- Report-Only with "Include as compliant" toggle — controls where the underlying Microsoft policy is deployed in Report-Only mode (the policy logs hits as if enforcing but doesn't block any sign-ins). These don't count as fully passed by default; they sit in a separate bucket because, strictly speaking, the policy isn't enforcing yet. The "Include as compliant" checkbox next to this metric toggles whether Report-Only controls roll up into the Passed count or stay as their own intermediate state. Default off (stricter); toggle on if your audit framework counts deployed-not-enforced as compliant.
- License Missing — the amber-bordered card alongside the metrics flags controls that couldn't be evaluated because your tenant doesn't hold the required Microsoft license. The detail card below the donut enumerates what was detected versus what's still needed — for the devlab example shown, two controls require Entra Workload ID Premium which isn't assigned to the tenant. License Missing controls are excluded from the score entirely (not counted as fail, not counted as pass) until the license is added and the scan re-runs.
The horizontal color-legend bar under the donut breaks the same numbers down by category at a glance: green = Passed, cyan = Report-Only, red = Failed, amber = License Missing, gray = Skipped.
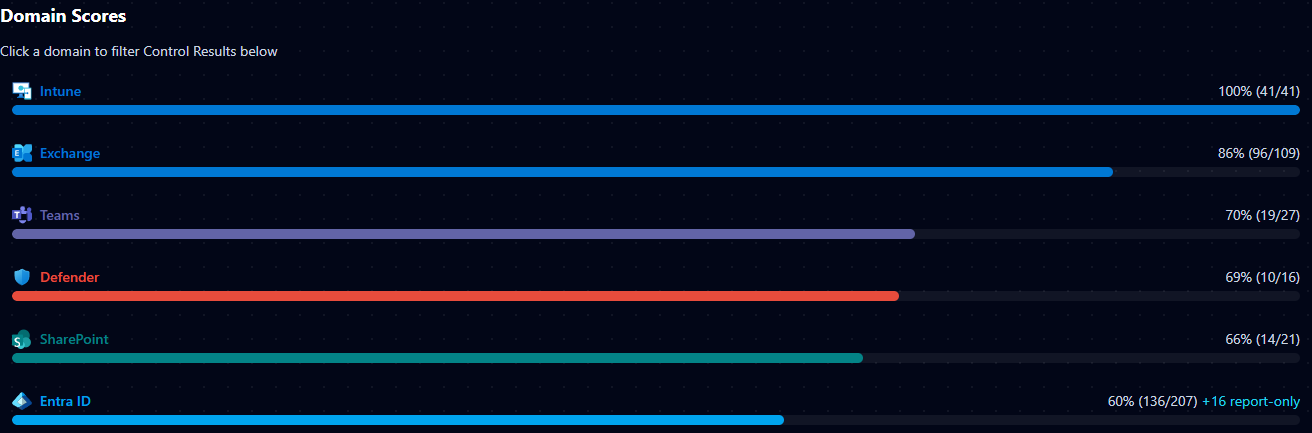
8.9 · Domain Scores
Below the headline score, six domain rings break the same number out per Microsoft 365 workload: Identity & Access, Intune Device Management, Exchange Online, Microsoft Teams, SharePoint Online, and Defender for Office 365. Each ring shows the per-domain pass rate and a delta from the previous scan.
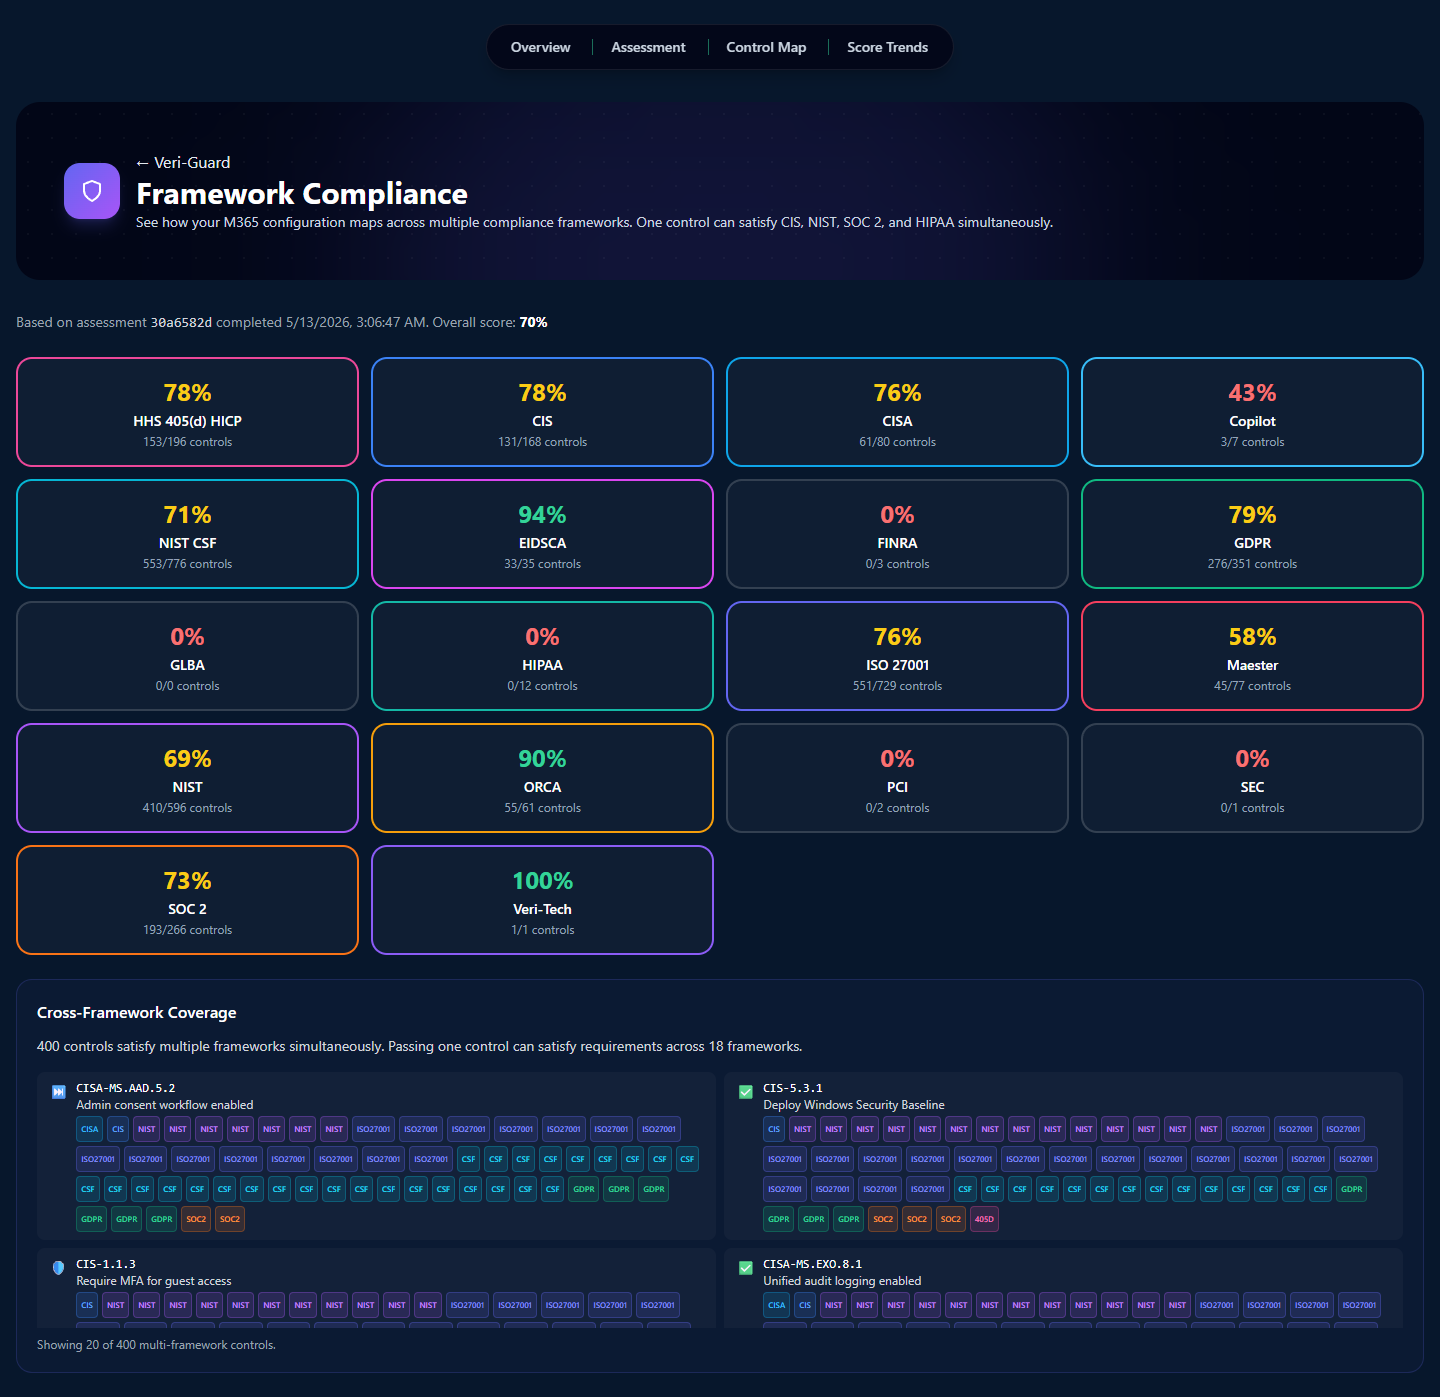
8.10 · Framework Compliance
Beneath the domains is the framework compliance grid. This is the surface that auditors care about most — one row per framework, one progress bar showing how many of the framework's mapped controls passed.
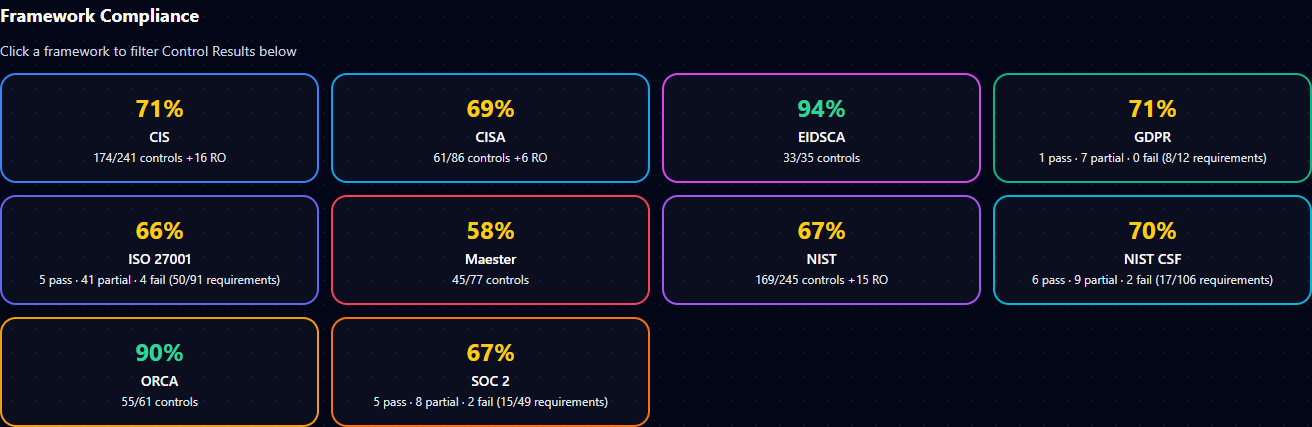
If an auditor only wants CIS evidence, filter to CIS and the rest of the page narrows to just the controls they care about. The Compliance Packages exports (§8.6) are framework-scoped versions of this same view.
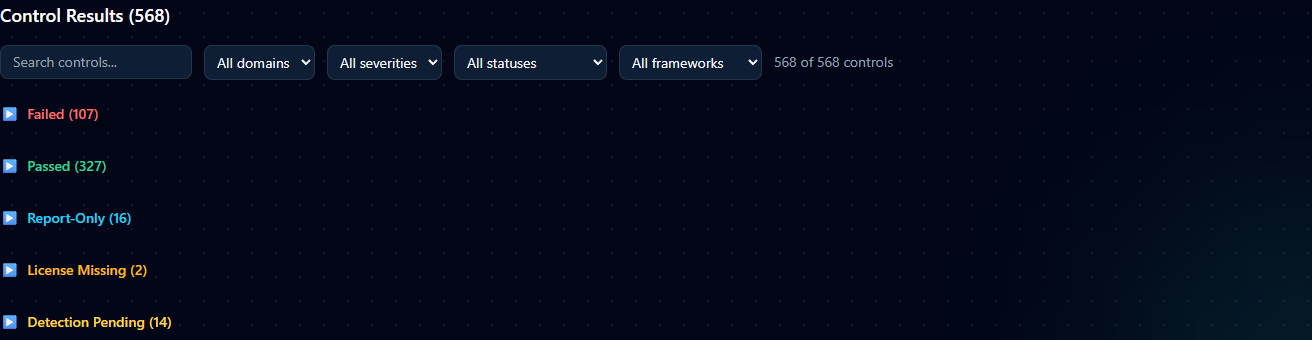
8.11 · Control-level results table
The full control table sits below the framework grid. Each row is one of the 548 controls: pass/fail status, severity, mapped frameworks (as chips), control title, and an "Open" link to a drawer with the full control detail — description, expected configuration, current configuration in your tenant, mapped frameworks, references, and the per-control runbook.
8.12 · Quick Win Bundles
The Quick Win Bundles card is the fastest path from "I have 200 failing controls" to "I have a plan." It groups failing controls into high-impact, low-effort bundles — each bundle is a small set of related fixes that move the score noticeably with one focused remediation session.

8.13 · What-If Simulator
The What-If Simulator lets you project the score delta from fixing any subset of controls before you actually run the remediations. Useful when prioritizing — pick the bundle that gets you over an audit threshold without spending time on a control set that barely moves the needle.

9 · Remediation
Two paths through remediation, and the right choice depends on your plan tier and your team's preferences.
Path A — Generate a runbook, your team executes it. Available on every tier. Every failing control gets a step-by-step runbook in your choice of admin portal UI click-through, PowerShell, or Graph API, with expected output and rollback steps. Your team copies the runbook into a change ticket and applies it by hand. This is the default path most enterprise teams use because it lands inside their existing change-management process.
Path B — Auto-remediate (Enterprise tier). For the 330+ controls Veri-Guard knows how to auto-fix, click "Remediate" on the control row or the bundle. Veri-Guard requests Just-in-Time write permissions, applies the fix (Conditional Access lands in report-only mode, break-glass accounts excluded), and auto-revokes the write permission when done.
The rest of this section walks both flows page-by-page, surface-by-surface. Two pages get covered in depth: the Remediation Planning page (§9.1–§9.9) and the Dispatch Remediation page (§9.10–§9.16), followed by the JIT safety model (§9.17) and the report-only / rollback deployment behavior (§9.18).
9.1 · The Remediation Planning page
Clicking "Plan Remediation for N Controls" on the entry card in §8.5 lands you on the full Remediation Planning page at /guard/[jobId]/remediate. The page is the staging area where you decide which controls to remediate and how.

Layout top-down: page header, AI plan generator, license-blocked controls flagged separately, then the stats bar, export plan toolbar, license detail, filter and bulk-action toolbar, the per-control table, and Review and Deploy CTA at the bottom. §9.2–§9.9 walk each in order.
9.2 · AI Remediation Plan generator
At the top of the page sits the AI Remediation Plan card. Click "Generate Plan" and the LLM produces a prioritized remediation plan that groups your failing controls into logical deployment phases by risk and dependencies.
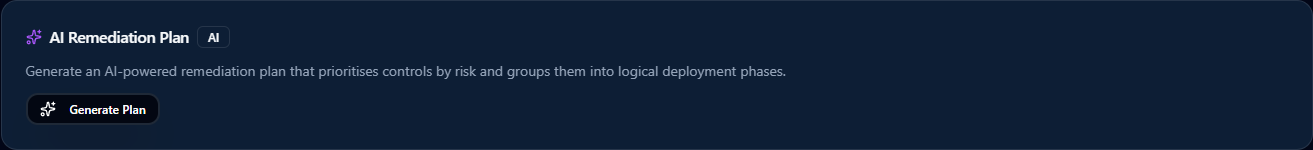
Output is a multi-phase rollout: typically a "must-fix-first" phase covering prerequisites and high-risk Identity controls, a "core hardening" phase that batches dependent controls together, and a "long tail" phase for controls that can be deferred without immediate risk. You can override the generated grouping — the AI's grouping is advisory, not enforced.
9.3 · License-blocked controls
Below the AI plan is a flagged warning section for controls that can't be remediated because your tenant doesn't have the required Microsoft licenses.
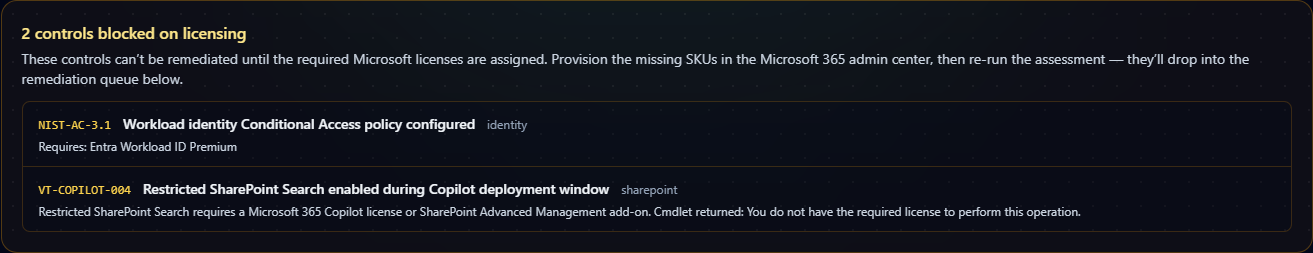
These controls are pulled out of the auto-deploy queue so you don't waste a JIT dispatch on a write that's guaranteed to fail. The fix is to provision the missing license (in this devlab example: Entra Workload ID Premium and a Microsoft 365 Copilot license / SharePoint Advanced Management add-on) and re-run the assessment — the controls then drop back into the remediation pipeline as either auto-deploy or runbook-only depending on type.
9.4 · Failed-controls breakdown and break-glass display
Below the license-blocked warning, a horizontal status bar breaks the failing controls into auto-deploy vs runbook-only paths and displays the configured break-glass accounts.

A few details on this bar:
- 107 failed controls — headline count from the assessment.
- 29 to auto-deploy — the subset Veri-Guard knows how to write directly via Graph (Enterprise tier, with JIT consent). The "with your approval" tag means each control still requires an explicit Remediate click before the worker writes — "auto-deploy" doesn't mean "fires automatically."
- 78 runbook only — controls that Veri-Guard generates a runbook for but doesn't write directly. Happens when a control requires manual UI work (an admin-portal blade with no Graph equivalent) or when Microsoft's service-side denies app-only writes on the relevant cmdlet (the
Set-CsTeams*PolicyRpException40301case). - Break-glass: am w****m — masked names of the break-glass accounts configured for this tenant. These accounts are excluded from every Conditional Access policy Veri-Guard deploys, and the exclusion is verified before any write operation runs (the safety model from §5).
9.5 · Export the plan
Right below the stats bar is a small toolbar for exporting the remediation plan offline.

Three formats: HTML for sharing as a web page or rendering in a review tool, Markdown for pulling into a ticket or issue, PDF for offline review. The export honors the current filter state — if you've narrowed the planner to a specific domain or severity, only those controls are included.
9.6 · Search, filter, and bulk actions
A horizontal toolbar above the per-control table provides search, domain filters, and bulk actions.

The bulk-action buttons operate on the filtered set, not the global one. If you filter to "Identity" only, "Remediate All" remediates only the Identity controls. Accept All runs the filtered controls through Risk Exceptions (§8.3) with a generic justification — typically you'll want to apply a more specific per-control justification before doing this in production.
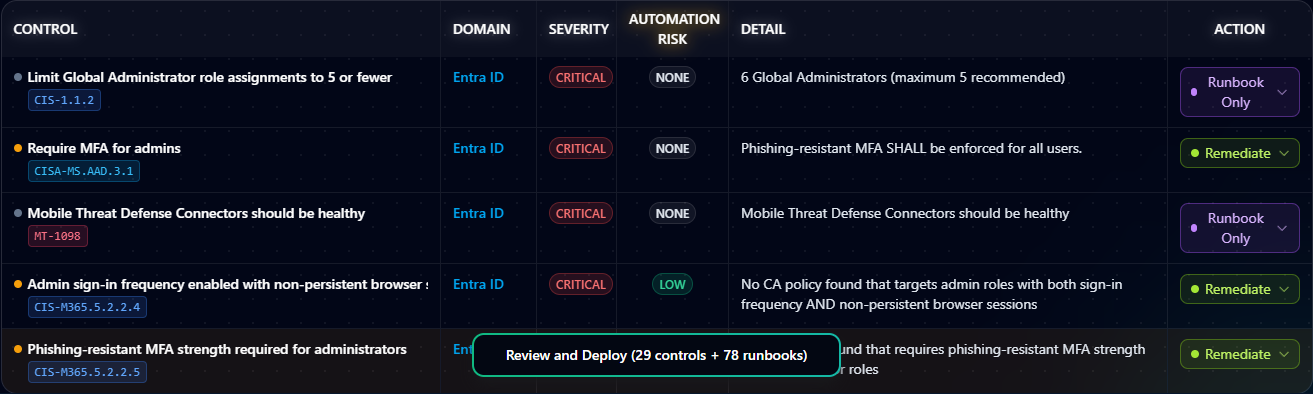
9.7 · The per-control planner table
The main body of the page is the per-control table. Each row is one failing control with its domain, severity, automation risk rating, and a per-control action button.
The columns:
- Control — the control ID and short description.
- Domain — Identity, Intune, Exchange, Teams, SharePoint, Defender, or Purview.
- Severity — Critical / High / Medium / Low / Informational, color-coded.
- Automation Risk — None / Low / Medium / High / Critical. Veri-Guard's rating of how disruptive the auto-remediation is likely to be in production. Critical is reserved for changes that block sign-ins or invalidate sessions; None is for read-only or behind-the-scenes changes.
- Detail — expands a per-control drawer with the failing condition, expected configuration, and per-control runbook.
- Action — the per-control button: Remediate (auto-deploy) for the 29 eligible controls, Runbook Only for the 78 manual-execution controls.
9.8 · Review and Deploy
At the bottom of the page sits the primary CTA — Review and Deploy.

The button label shows the current selection — "(29 controls + 78 runbooks)" in the devlab example. Clicking it doesn't execute anything immediately; it opens the Confirm modal where you have one more chance to back out.
9.9 · Confirm Remediation Deployment
The Confirm Remediation Deployment modal is the deliberate "are you sure" gate before Veri-Guard navigates to the Dispatch page.
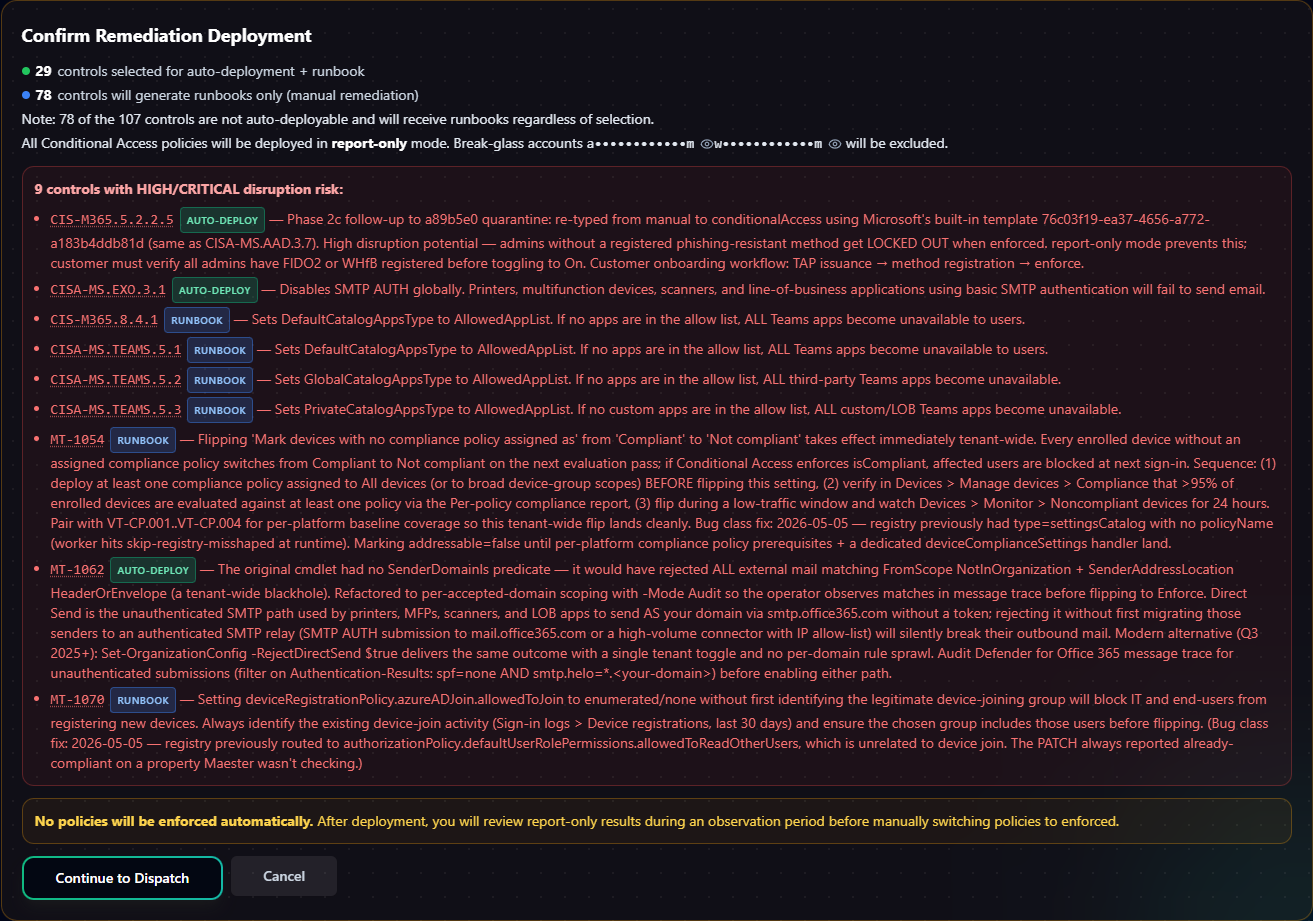
The modal lists each control in the dispatch, shows its automation risk rating, and asks you to acknowledge disruption risk. "Continue to Dispatch" opens the Dispatch page (§9.10) where the actual write authorization happens. "Cancel" closes the modal — the planner state is preserved so you can adjust the selection before re-trying.
9.10 · The Dispatch Remediation page
Continuing from the Confirm modal lands you on the Dispatch page at /guard/[jobId]/remediate/dispatch?selection=.... This is the explicit, in-portal staging step before any tenant-side write happens.

The page is structured top-down: how dispatch works → pre-deploy review → the actual control list split into Auto-Remediate (Delegated) and Runbook Only → the Grant Write Access CTA. §9.11–§9.16 walk each.
9.11 · How dispatch works
A condensed explainer card sits at the top of the Dispatch page summarizing the deployment flow.
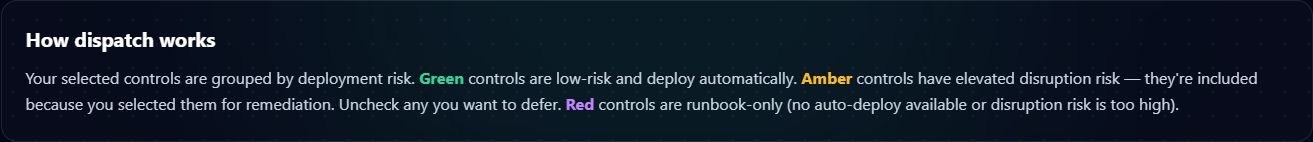
The card is a quick-reference summary of the safety model from §5 — green markers for low-risk fixes, amber for elevated disruption risk, red for high-risk changes that require explicit acknowledgement. It's a visual cue layered on top of the same model the planner enforces, not a separate enforcement layer.
9.12 · Pre-Deploy Review
Below "How dispatch works" is the Pre-Deploy Review section — change-board-friendly artifact exports.
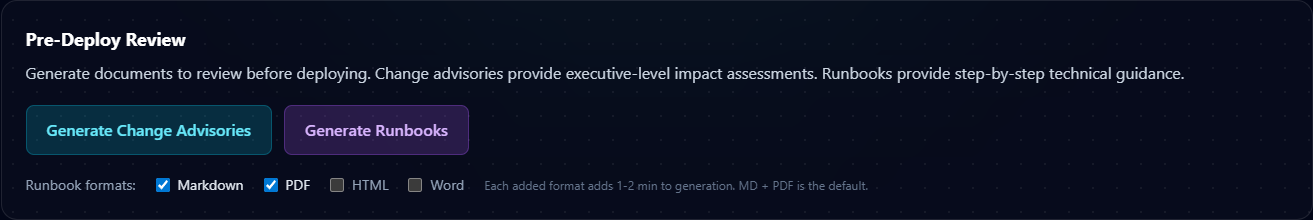
Three things this section exposes:
- Export Report (HTML / Markdown / PDF) — same export options as the planner page's Export Plan, but scoped to just the controls in this dispatch.
- Generate Change Advisories — formal change-management documents for each remediation, written in the format most change boards expect (description, scope, risk rating, rollback procedure, dependencies).
- Generate Runbooks — bulk-generate the per-control runbooks for every runbook-only control in this dispatch, packaged together.
9.13 · Auto-Remediate (Delegated)
The first of the two control sections is Auto-Remediate (Delegated), showing the 29 controls staged for auto-deploy. Each row is a single control with its risk markers visible.
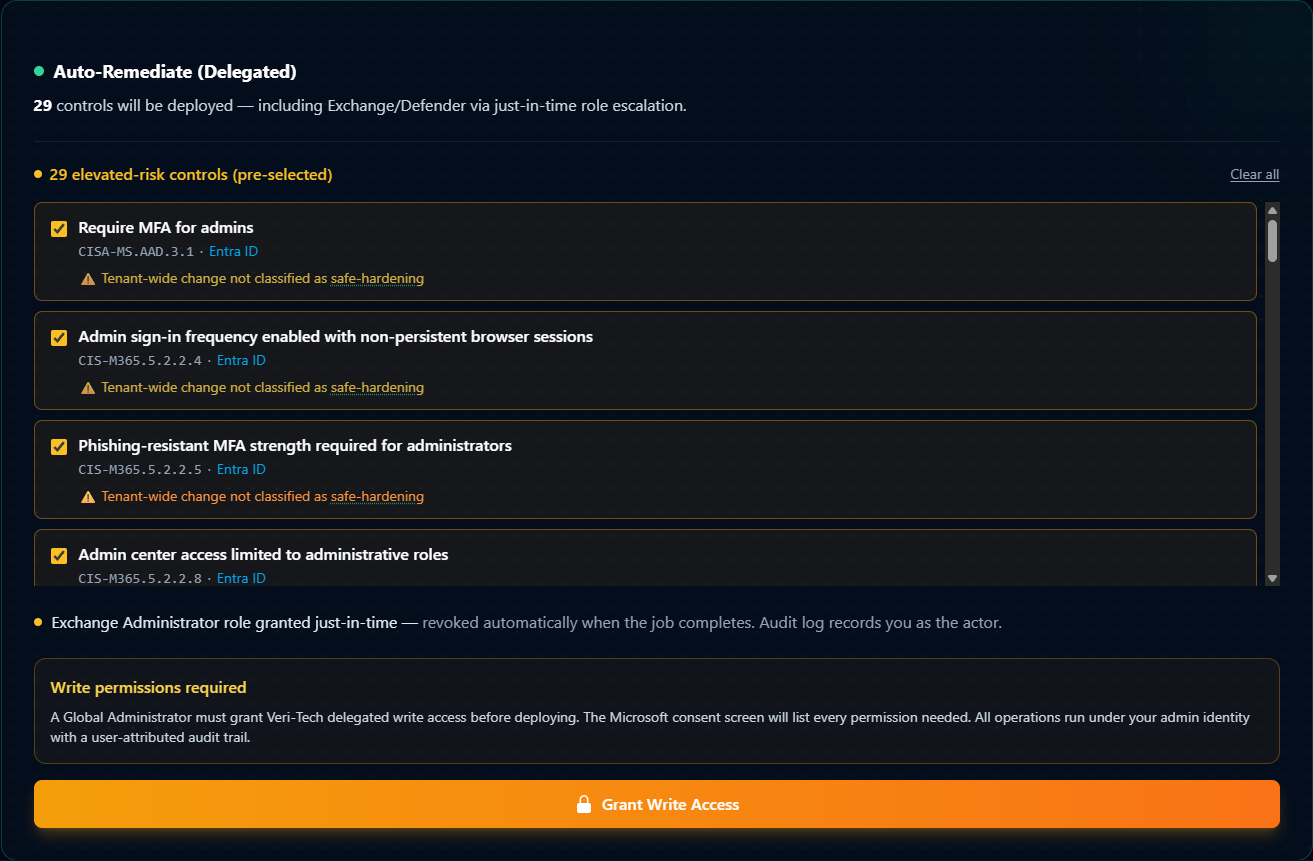
The risk flags on each row are control-specific — they identify what kind of disruption could plausibly occur if the change goes wrong. "Require MFA for admins," "Admin sign-in frequency enabled with non-persistent browser sessions," "Phishing-resistant MFA strength required for administrators" — each is a calibrated warning specific to that control's deployment surface, not generic boilerplate.
9.14 · Runbook Only
Below the auto-remediate section is the Runbook Only section, listing the 78 controls that don't auto-deploy.
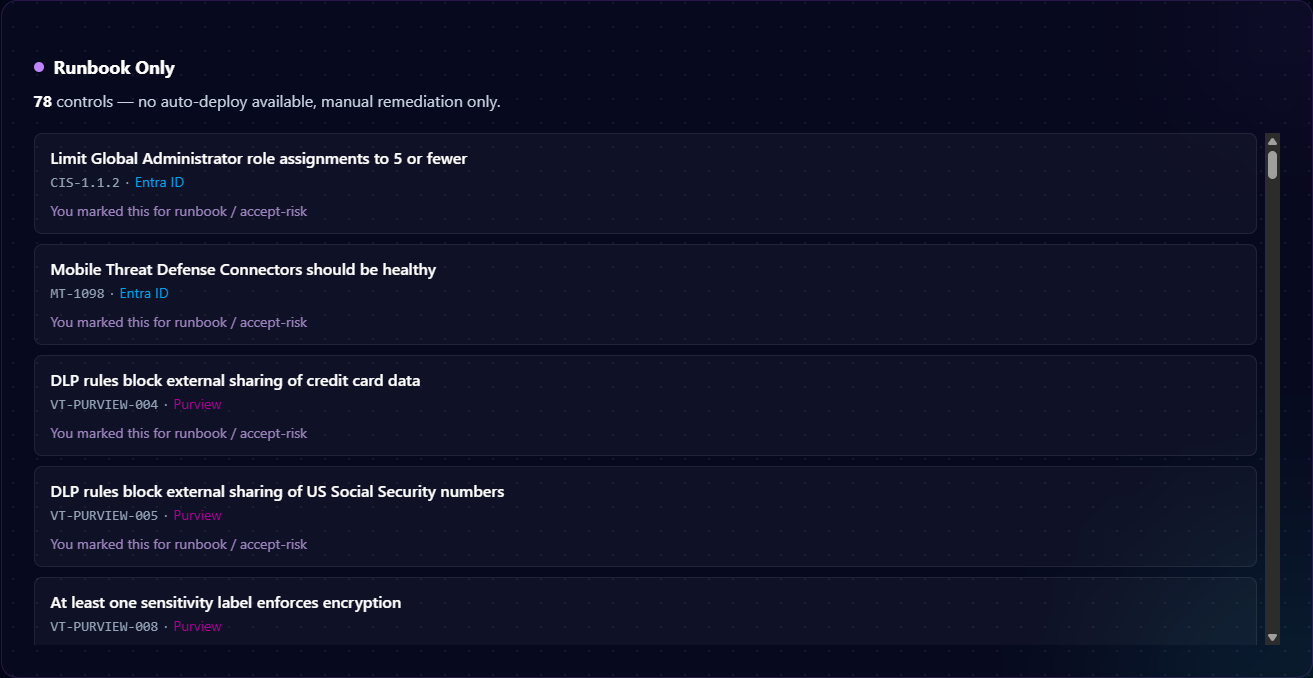
A control lands in Runbook Only for one of two reasons: (1) the Microsoft Graph API doesn't expose a write endpoint for the underlying configuration (the setting is only reachable from an admin-portal UI blade), or (2) Microsoft's service-side denies app-only writes on the cmdlet (the Set-CsTeams* PolicyRpException 40301 case). For these controls, Veri-Guard generates an executable runbook your team applies by hand — and the audit trail follows your team's change-management ticketing, not Veri-Tech's.
9.15 · Grant Write Access
At the bottom of the Dispatch page sits the JIT consent CTA — the moment write authority actually moves.
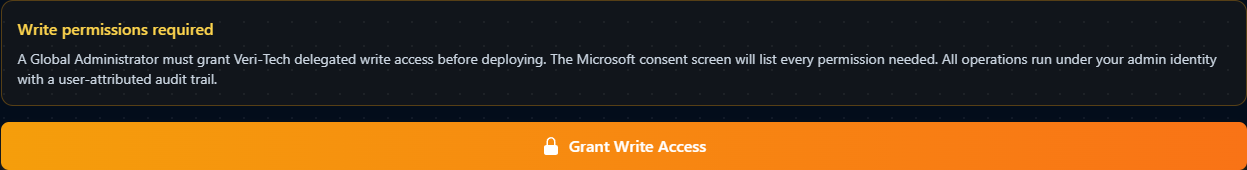
This is the explicit threshold between "Veri-Guard has only read access on your tenant" and "Veri-Guard has delegated write access for this specific batch." The button is a hyperlink to Microsoft's OAuth consent endpoint (login.microsoftonline.com/.../oauth2/v2.0/authorize?...&prompt=consent). Clicking it navigates the browser to the Microsoft consent screen.
9.16 · The Microsoft consent screen
After clicking Grant Write Access, you're on a system-level Microsoft consent screen that enumerates every delegated write scope being requested for this dispatch.
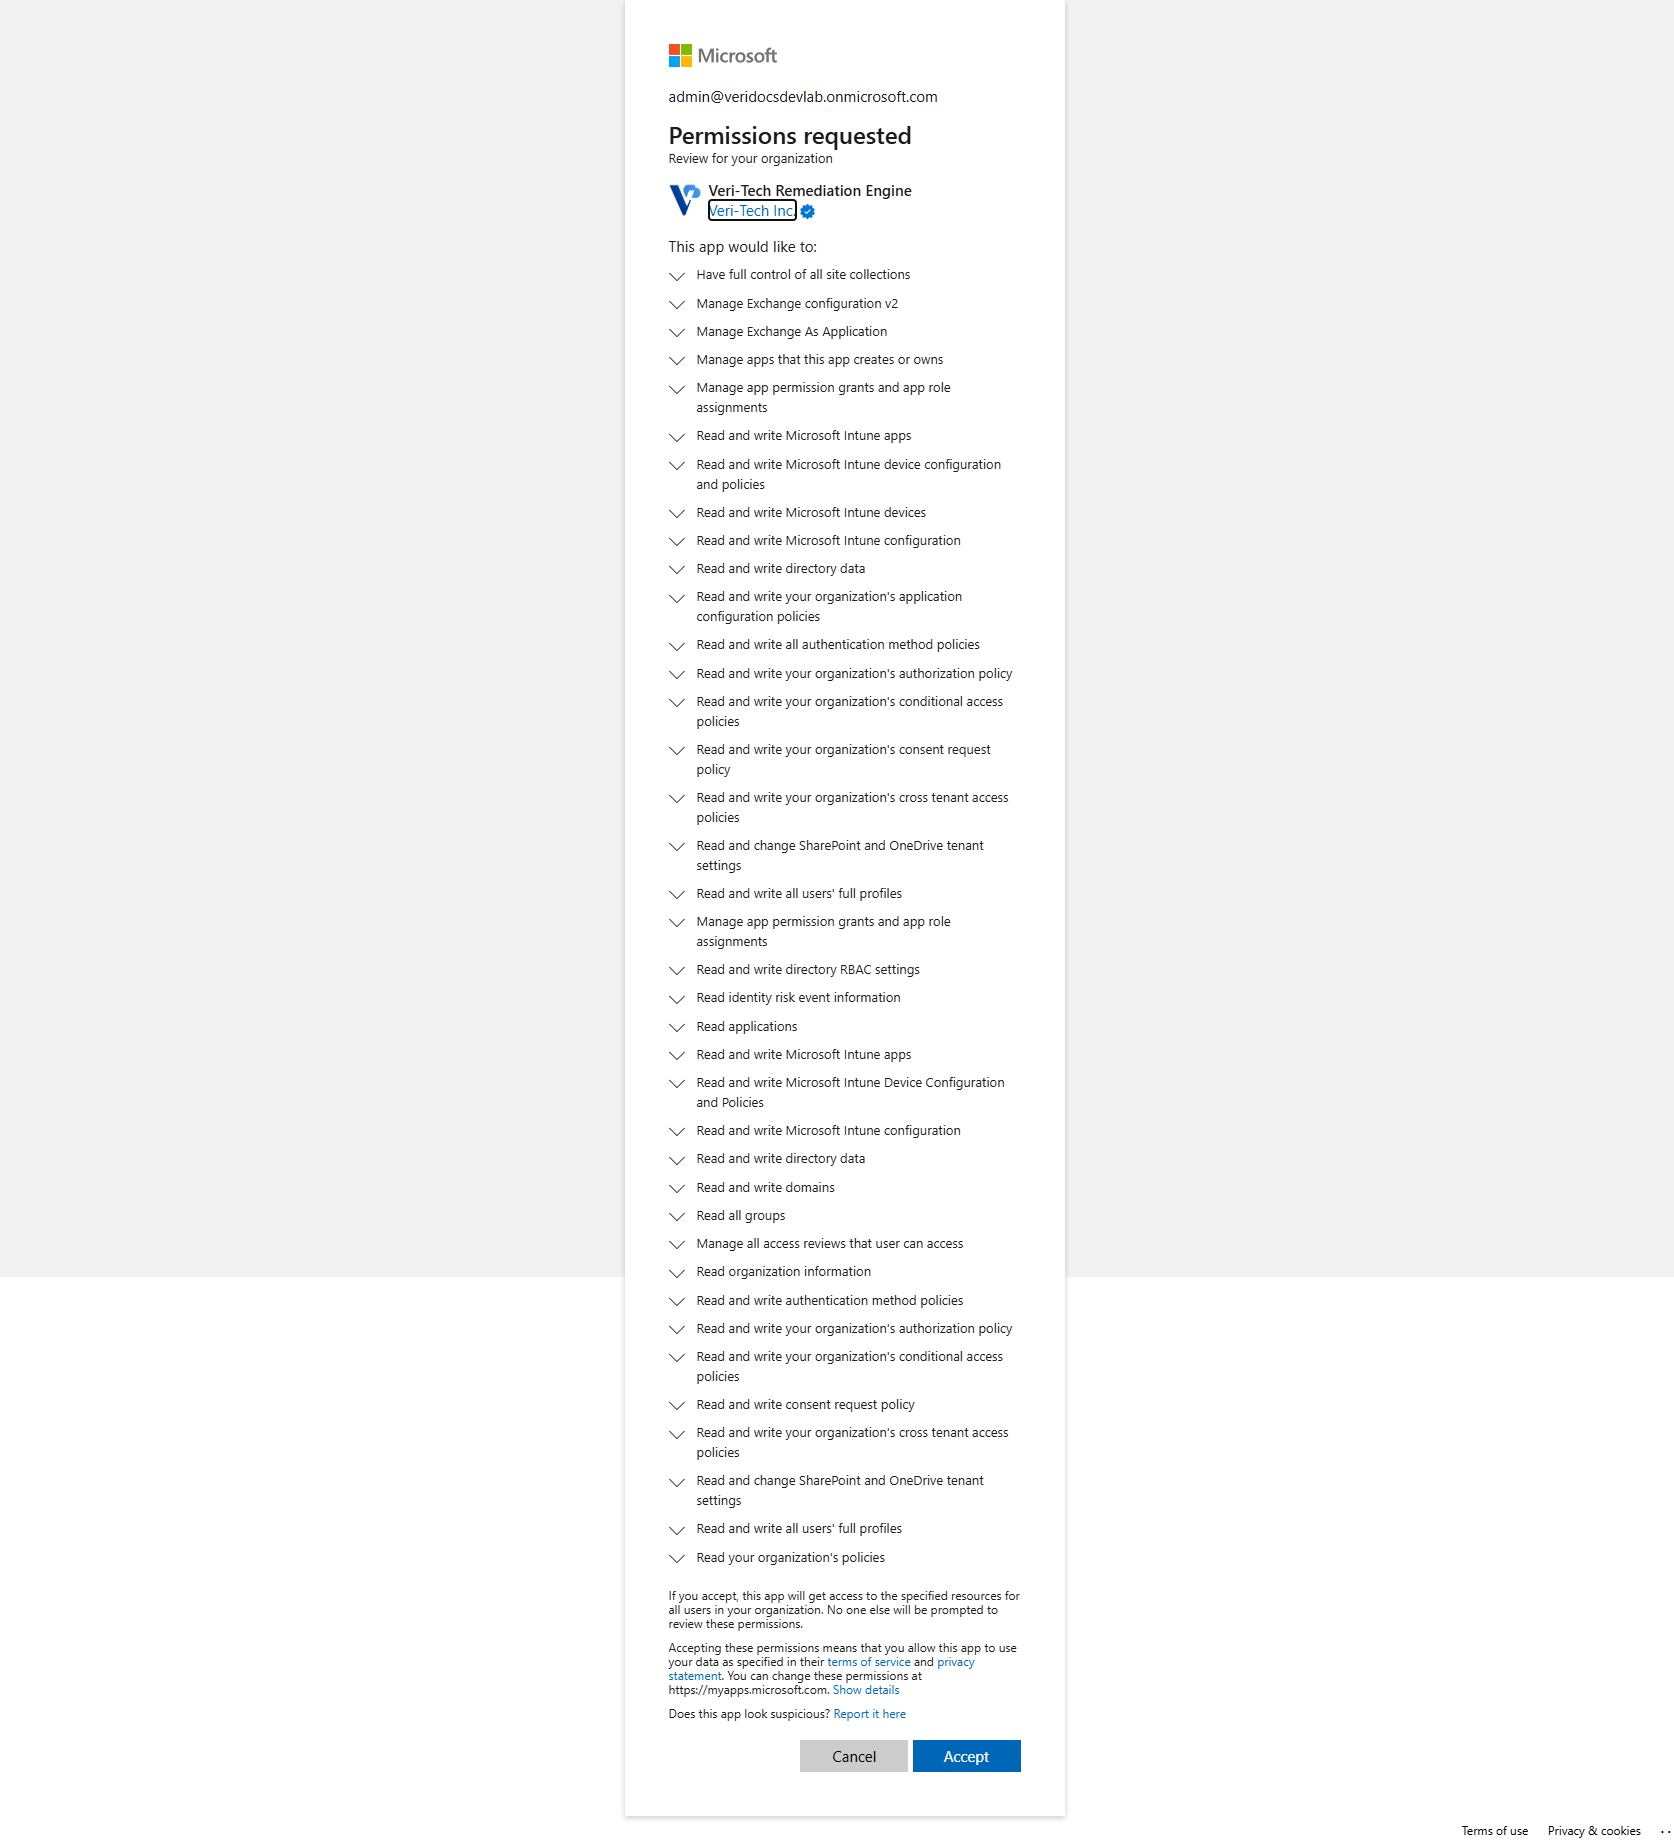
Microsoft enumerates every permission line by line — Conditional Access policies, authentication method policies, Intune device configuration, SharePoint tenant settings, directory data. The operator approving consent sees exactly what's being authorized before they click Accept. Cancel returns to the Dispatch page without any grant taking effect.
9.17 · The JIT model: delegated, time-bounded, revocable
This subsection covers the safety model behind §9.15–§9.16, because the actual mechanics matter to a security-conscious admin.
Delegated permissions, not application permissions. Veri-Guard's everyday operation uses application permissions — Microsoft Graph scopes granted to the Veri-Tech application at onboarding (via certificate-based authentication), scoped strictly to the read-only configuration listed in §4. The app holds those scopes on its own and never needs an admin to sign in for an assessment. That's how 100% of Veri-Guard read traffic works, and how every other product in the Veri-Tech suite (Veri-Tune, Veri-Patch, Veri-Vault, Veri-Docs) operates from end to end — application permissions, read-only by design.
Write traffic on Veri-Guard is different. For the 330+ controls Veri-Guard knows how to auto-remediate, write access is delegated, not application — an admin (you, signed in at the consent screen in §9.16) authorizes Veri-Guard to act on your behalf, for the specific batch of controls in this dispatch, for the length of time it takes to apply them.
What "Just-in-Time" actually means here. The JIT guarantee has four parts, and all four matter:
- Just-in-Time grant. The OAuth flow only fires when you click "Grant Write Access" on the Dispatch page. There is no standing write consent on your tenant before this moment, and no path through the product that grants standing write access at any other time.
- Just-this-batch scope. The elevated permission is used only by the remediation worker that processes this one dispatch. A second click on Remediate thirty seconds later triggers a fresh consent prompt and a fresh grant — even for the same controls, even for the same admin. Veri-Guard does not pool, cache, or "reuse" the consent for convenience.
- Just-this-admin context. Every Graph write is performed under the identity of the admin who granted consent, not under a Veri-Tech service principal. Your tenant's Microsoft audit logs attribute the change to your admin's UPN. The accountability trail does not get laundered through "an automation."
- Auto-revoke after success; one-hour TTL on failure. When the worker successfully finishes the dispatch, Veri-Guard explicitly discards the tokens it received from the consent flow — the elevated grant is gone before the audit page loads. On a failed or abandoned dispatch, Veri-Guard does not currently force-revoke at the moment of failure; the access token Microsoft issued then expires on its standard one-hour TTL, and the delegated grant becomes unusable when it does. Either way, the revoke steps below let you short-circuit that hour if you'd rather not wait.
You can revoke at any time. The auto-revoke is Veri-Guard's job — but if it ever didn't fire (bug, network failure, abandoned dispatch), you don't have to wait on us. Four revoke paths, ordered closest-to-furthest from where you're standing:
- In-product, on the Dispatch page itself. The same Dispatch page where you clicked "Grant Write Access" exposes a "Revoke auto-remediation" control on every batch you've consented to. Click it and Veri-Guard discards the tokens immediately, the same way the success path does. This is the fastest path and doesn't leave the portal.
- Per-user self-revoke at Microsoft. Sign in to https://myapps.microsoft.com, find "Veri-Tech Remediation Engine," click Remove. Drops your personal delegated consent. The Microsoft consent screen explicitly references this URL ("You can change these permissions at https://myapps.microsoft.com").
- Org-wide admin revoke. Entra admin center → Enterprise applications → Veri-Tech Remediation Engine → Permissions → Revoke. Removes the admin-on-behalf-of-org consent grant. After this, every admin in your tenant would need to re-consent before Veri-Guard could remediate anything.
- Delete the app registration entirely. Entra admin center → Enterprise applications → Veri-Tech Remediation Engine → Properties → Delete. Pulls the rug. Both standing read application permissions (the Veri-Tech onboarding app) and delegated remediation grants disappear. Veri-Guard cannot run again on this tenant until you re-onboard from scratch.
The last three revoke paths are Microsoft's, not Veri-Tech's. We can't hide them, suppress them, or work around them. The trust boundary is at the Entra layer.
What this means in practice. The model is designed so a security-conscious admin can answer a single audit question — "what could Veri-Tech do to my tenant if their infrastructure was compromised right now?" — with a single sentence: they can read the configuration scopes listed at /onboarding, and nothing else. There is no standing write credential to steal. The delegated write access exists only during a remediation window the admin explicitly opens, only under that admin's own identity, and only for the controls in that specific dispatch.
That's the entire safety model from §5 made concrete: standing access is read-only application permissions; write access is deliberately consented, per-batch, per-admin, delegated, time-bounded by Microsoft's one-hour access-token TTL at the outside, revocable by you at any time, and discarded by Veri-Guard at the end of a successful dispatch.
9.18 · The Remediation Deployment page
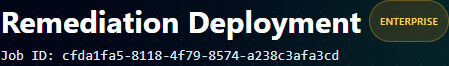
When the worker finishes the dispatch, the browser auto-redirects to a Remediation Deployment page at /guard/[deploymentId]. This is the "what just happened" view — your before/after score, what was actually deployed, what failed, what's still on the roadmap, and the exports an auditor would want.
The page is structured top-down: Compliance Score Impact → Deployment Summary → Next Steps → Executive Summary (downloadable) → Export Report (raw export) → the per-control results table. §9.19–§9.24 walk each in order.
9.19 · Compliance Score Impact
The top band of the page shows three score rings side-by-side: your score before the remediation ran, your score after (only counting what auto-deployed successfully), and your projected score if you also execute the runbook-only controls by hand.

The three-ring layout is deliberate: the After Remediation ring is what your tenant actually scores right now, while If Runbooks Used is the upper bound assuming your team also runs the runbook-only controls from §9.14. The gap between the two rings is your remaining runbook work.
9.20 · Deployment Summary
Below the score rings is a one-line summary of the dispatch outcome.
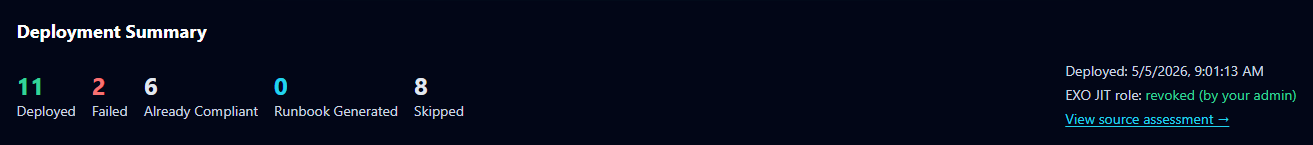
The buckets:
- Deployed — controls Veri-Guard auto-fixed successfully in this dispatch.
- Failed — controls Veri-Guard attempted but Microsoft Graph rejected. Each failed control appears in the table below with a detail message (typical causes: tenant-side licensing limits, race conditions with admin-portal changes happening during the dispatch, or transient throttling).
- Already Compliant — controls Veri-Guard re-checked at deploy time and found already passing. These are not counted as deploys; they're a graceful no-op.
- Runbook Generated — runbook-only controls that produced a runbook artifact in this dispatch (0 in this example because the dispatch was Auto-Remediate Delegated only).
- Skipped — controls excluded for reasons calculated at the JIT moment (license missing, prerequisite check failed, etc.).
The top-right shows the deploy timestamp, the post-deploy JIT role status (revoked (by your admin) confirms the auto-revoke fired), and a link back to the source assessment job for cross-referencing.
9.21 · Next Steps
A short Next Steps block reads the deployment summary and tells you what to do next.
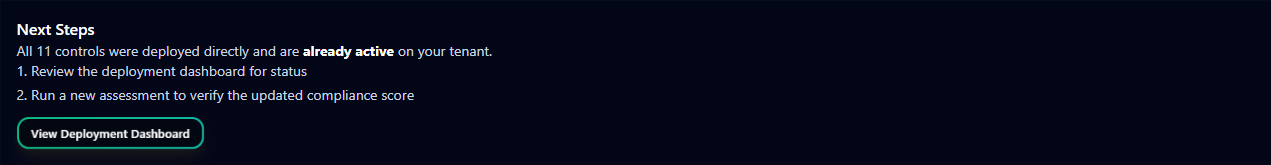
The recommendations are calculated from the dispatch outcome: a clean all-deployed dispatch points you to verification (re-run an assessment to confirm the score lift); a partial-failure dispatch points you to the per-control runbooks for the ones that didn't auto-fix. The "View Deployment Dashboard" link goes to a tenant-wide view of every remediation run over time.
9.22 · Executive Summary
A board-ready exec report is downloadable in two formats directly from this page.

This is the artifact most useful for the post-remediation cadence with leadership: it doesn't dump the raw control table, it tells the score-impact story with the same Before / After / If-Runbooks-Used framing from §9.19, plus the per-domain breakdown of where the lift came from.
9.23 · Export Report
For change-management and audit purposes, the full remediation result is exportable as a standalone report.
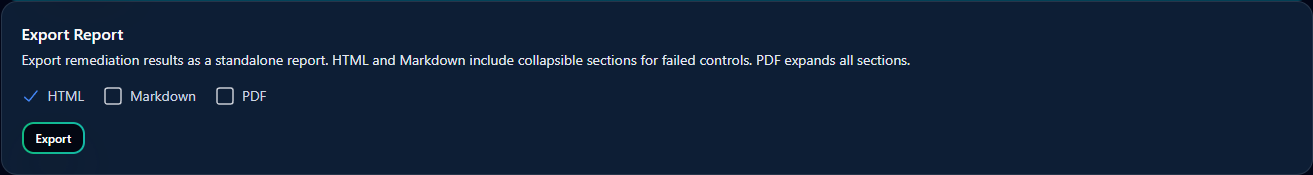
Three formats:
- HTML — interactive (collapsible failed-control sections), good for sharing as a link in a ticket.
- Markdown — for pasting into a change ticket, a Confluence page, or an internal wiki. Failed controls stay collapsed by default.
- PDF — flat, all sections expanded, intended for offline review or print.
The exported report uses the same data as the page; nothing is omitted from the export. Audit-friendly.
9.24 · Control Results table
The bottom half of the page is the per-control table — one row per control in the dispatch, color-coded by deployment status, with the full detail of what the worker did.
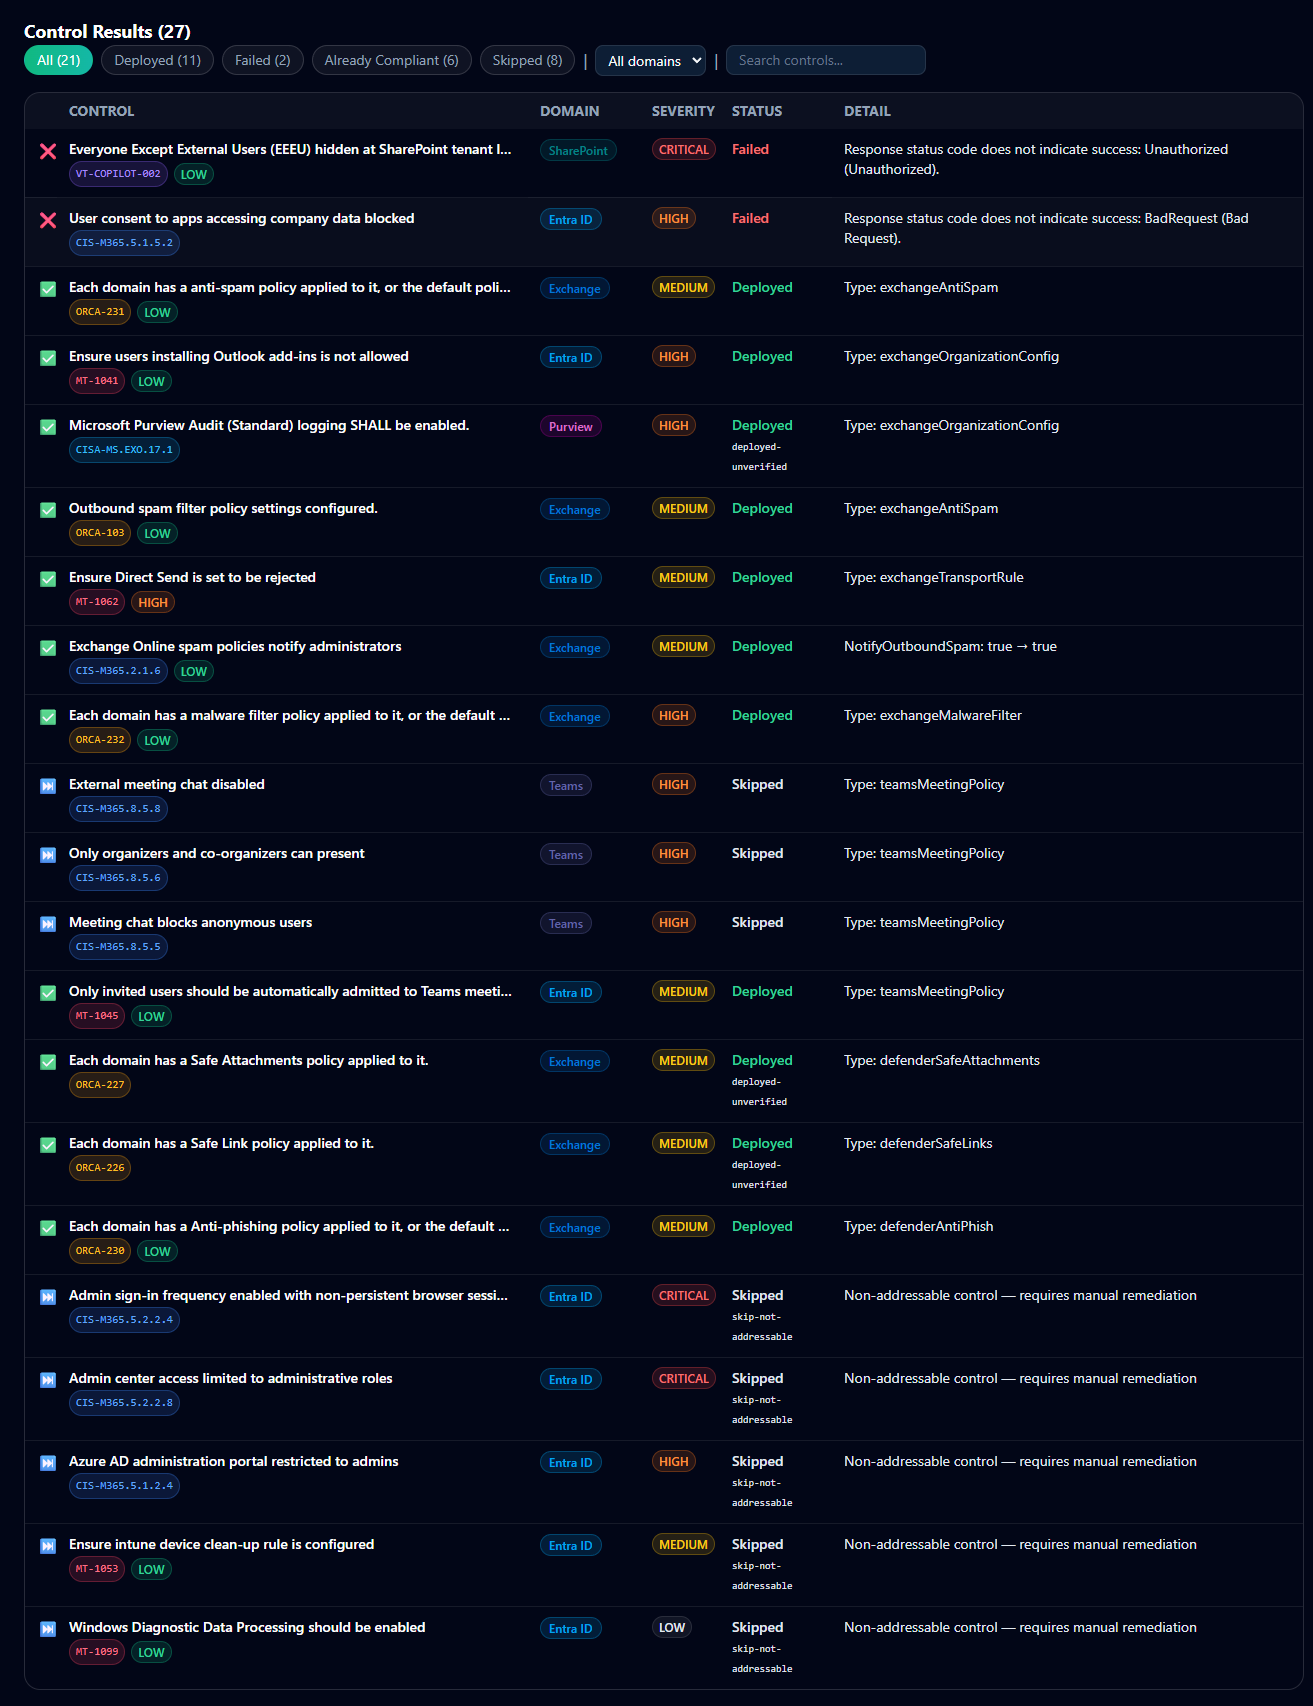
The filter chips at the top let you scope the view by status — Deployed, Failed, Already Compliant, Report-Only, Skipped. The Detail column carries the actual Graph response or runbook reference: for Failed rows, it's the Graph error string (Response status code does not indicate success: Unauthorized (Unauthorized), BadRequest (Bad Request)); for Skipped rows, it's the reason (Non-addressable control — requires manual remediation); for Deployed rows, it's the deployed resource type (type: exchangeAntiSpam, type: ManagementPolicy).
This is the artifact most useful for the engineer who actually has to chase down the 2 Failed controls — every row tells you exactly what to look at next, and clicking through expands to the per-control runbook regenerated against the post-deploy state.
9.25 · The Deployment Dashboard
The Deployment Dashboard at /guard/deployment is the post-remediation cockpit — a single page that shows where the tenant sits in the report-only-to-enforcement lifecycle, what's been deployed so far, and what's blocking the next step. Reach it from the "View Deployment Dashboard" button on the Remediation Deployment page (§9.21), or directly at /guard/deployment.

§9.26–§9.28 walk each component on the page in order.
9.26 · Lifecycle Progress
The left side of the dashboard is a vertical checklist of the five lifecycle stages a deployment moves through, with the current stage highlighted and prior stages checked off.
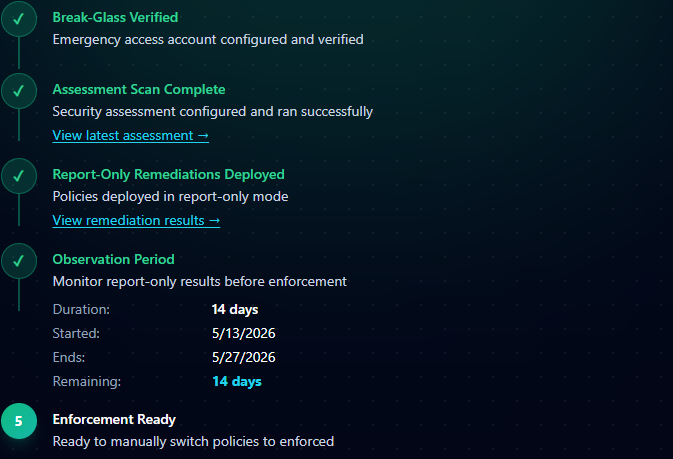
The stages, in order:
- Break-Glass Verified — the emergency-access account exclusion check has passed. This is a gate; without a verified break-glass configuration no Conditional Access policy will deploy.
- Assessment Scan Complete — there's a recent assessment to remediate against. Links to "View latest assessment."
- Report-Only Remediations Deployed — at least one remediation run has executed in report-only mode. Links to "View remediation results" — the Remediation Deployment page from §9.18.
- Observation Period — Veri-Guard's recommended monitoring window (default 14 days) where you watch the Entra sign-in logs to validate that the report-only policies are matching the sign-ins they're supposed to without blocking anything unintended. Shows duration, start date, end date, and days remaining.
- Enforcement Ready — once you've satisfied yourself with the observation-period data, this stage unlocks. Promote policies from report-only to enforcement from here.
Each stage is gated — you can't skip ahead without completing the prior ones, except via the explicit "Skip to Enforcement (Early)" path in §9.28.
9.27 · Status cards
Three side-by-side cards summarize current tenant state.
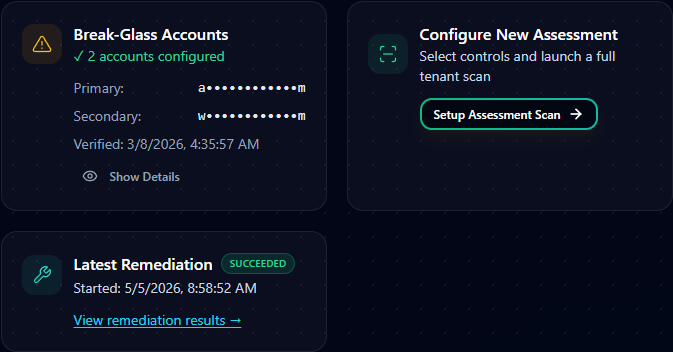
- Break-Glass Accounts — the masked names of the break-glass accounts configured for this tenant plus the last-verified timestamp. "Show Details" expands the full account configuration. These are the accounts excluded from every Conditional Access policy Veri-Guard deploys (§5).
- Configure New Assessment — direct CTA to launch a new assessment scan (same configurator from §7.3). Useful when you want a fresh re-scan to verify the score lift from the most recent deployment, or to scope a narrower assessment after the first full run.
- Latest Remediation — status of the most recent remediation run (succeeded / failed / partial), the timestamp it started, and a link back to its Remediation Deployment page (§9.18).
9.28 · Observation Period
The Observation Period card surfaces the deployment lifecycle's monitoring window in more detail.
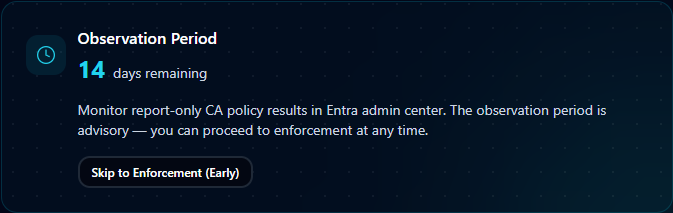
The observation period is Veri-Guard's recommended buffer between deploying a report-only policy and promoting it to enforcement — typically 14 days, during which you watch the Entra sign-in logs to confirm the policy is matching the sign-ins it's supposed to match, without inadvertently blocking legitimate access patterns. "Skip to Enforcement (Early)" lets you bypass the window if you've already validated; the recommended path is to let the full period elapse before promoting policies to On.
9.29 · Report-only deployment and rollback
For Conditional Access controls, the deployed policy always lands in report-only mode. The policy is created and logs hits as if it were enforcing, but does not block any sign-in. You verify the policy is doing what it should from the Entra sign-in logs (or via the Observation Period guidance in §9.28), then promote it to "On" yourself when you're ready.
If anything looks wrong, the rollback button on the assessment's audit log reverts the last 24 hours of remediation actions. Every write Veri-Guard performs is logged with the prior value, so rollback restores the exact pre-remediation state.
10 · Where to go next
You've now seen every page Veri-Guard puts in front of you. The fastest way to internalize the rest is to run an assessment against your own tenant:
- Sign in and open Veri-Guard at
/guard. - Click "Run scan" on the Step 01 card and accept the defaults in the configurator.
- Wait three minutes; read the results.
- Pick one Quick Win Bundle; either copy the runbook into a change ticket, or — on Enterprise — click Remediate and walk through the JIT consent flow.
If anything in this guide is unclear or you'd rather walk through it with a person, the support tutorials at /support/tutorials cover the most common Veri-Guard tasks in narrower five-to-eight-step recipes, and the Book a Call link in the page footer reaches an intro session.